Research Article | | Peer-Reviewed

Improving Anomaly Detection Accuracy Using Fuzzy Cuckoo-Inspired Clustering and Optimization Techniques

Received: 16 February 2026     Accepted: 1 June 2026     Published: 22 July 2026
Views:       Downloads:
Abstract

Anomaly detection is a critical task for identifying unusual patterns that may indicate security breaches, fraudulent transactions, or system failures in various application domains. Conventional anomaly detection techniques often experience high false positive rates and limited adaptability when handling complex, uncertain, or evolving datasets. To overcome these limitations, this study proposes a novel Fuzzy Cuckoo-Based Clustering Technique (F-CBCT) that integrates fuzzy logic with cuckoo search-based clustering and optimization. The proposed framework employs a decision tree classifier enhanced with fuzzy membership functions, enabling effective management of uncertainty during classification. Model parameters are optimized using a hybrid strategy based on Mean Square Error (MSE) and the Silhouette Index, improving clustering quality and classification accuracy. Experimental evaluations conducted on benchmark datasets demonstrate the effectiveness of the proposed approach, achieving a 96.86% detection rate, 97.77% accuracy, a 1.297% false positive rate, and an F-measure of 98.30%. Comparative analysis with existing state-of-the-art anomaly detection methods confirms that F-CBCT consistently outperforms conventional approaches in terms of detection capability, robustness, and reliability. The proposed technique effectively reduces false alarms while maintaining high detection performance, making it a promising solution for real-world anomaly detection applications across diverse and dynamic environments.

Published in Machine Learning Research (Volume 11, Issue 2)
DOI 10.11648/j.mlr.20261102.11
Page(s) 63-75
Creative Commons

This is an Open Access article, distributed under the terms of the Creative Commons Attribution 4.0 International License (http://creativecommons.org/licenses/by/4.0/), which permits unrestricted use, distribution and reproduction in any medium or format, provided the original work is properly cited.

Copyright

Copyright © The Author(s), 2026. Published by Science Publishing Group

Keywords

Fuzzy Clustering, Cuckoo-Inspired Optimization, Membership Functions, RMSE Analysis, Anomaly Detection, Intrusion Detection System (IDS)

1. Introduction
Anomaly detection is essential across various domains, including cybersecurity, healthcare, finance, and industrial systems. Its main goal is to detect data patterns or instances that significantly differ from typical or expected behavior. These anomalies often indicate critical events such as network intrusions, fraud, or system failures, making their accurate and timely detection crucial for safeguarding assets and ensuring system reliability .
Over recent years, the complexity and volume of data have increased exponentially, presenting significant challenges to traditional anomaly detection techniques. Traditional approaches frequently face challenges such as elevated false alarm rates and poor adaptability to changing or dynamic data patterns, and inefficiency in processing large-scale datasets . This has led researchers to explore advanced computational intelligence and machine learning approaches, including clustering algorithms, optimization techniques, and fuzzy logic, to enhance detection accuracy and reduce false alarms.
Clustering algorithms, such as K-means and hierarchical clustering, group similar data points to distinguish normal behavior from outliers. However, their performance heavily depends on cluster initialization and parameter selection, often resulting in suboptimal detection. Optimization algorithms like Particle Swarm Optimization (PSO) and Cuckoo Search Optimization (CSO) have been integrated with clustering to overcome these limitations by fine-tuning clustering parameters and improving convergence rates .
Fuzzy logic provides a versatile approach for managing the uncertainty and vagueness commonly found in real-world datasets, allowing for more refined and accurate decision-making in anomaly detection. Combining fuzzy logic with clustering and optimization strategies has shown promising results in achieving higher detection rates and lower false positive rates.
The experimental setup of this study is carefully designed to evaluate the effectiveness and robustness of the proposed method. It includes well-defined parameter configurations, benchmark comparisons, and rigorous validation strategies to ensure reproducibility and reliability of results .
The novelty of this work lies in the synergistic integration of fuzzy logic with an enhanced cuckoo search–based clustering framework for anomaly detection across both social and benchmark datasets. Unlike conventional clustering or swarm-based anomaly detection approaches, which typically rely on crisp data assignments or optimize a single objective, the proposed Fuzzy Cuckoo-Based Clustering Technique (F-CBCT) introduces a hybrid fuzzy–metaheuristic architecture. This architecture is specifically designed to handle uncertainty, capture non-linear relationships, and manage overlapping data distributions more effectively .
A key contribution of this study is the formulation of a dual-objective fitness function that simultaneously incorporates Mean Square Error (MSE) and the Silhouette Index (SI) within the cuckoo search optimization process. By jointly optimizing these two criteria, the method ensures both intra-cluster compactness and inter-cluster separation—an aspect that is often overlooked in existing CSO-based anomaly detection frameworks, which tend to focus on a single clustering objective .
In terms of parameter configuration, critical algorithmic components such as population size, discovery rate (pa), step size, and the number of iterations are systematically tuned to achieve optimal performance. Similarly, parameters governing fuzzy membership functions—including shape parameters for triangular, trapezoidal, Gaussian, generalized bell, and Pi-shaped functions—are adaptively selected to best fit the underlying data distributions . This adaptive configuration enhances the flexibility and generalization capability of the proposed model across heterogeneous datasets.
Furthermore, the integration of multiple fuzzy membership functions enables the model to represent diverse data characteristics effectively, improving robustness in handling noisy and complex data environments.
To validate the performance of the proposed framework, a combination of internal and external evaluation metrics is employed. Internal validation is conducted using metrics such as MSE and Silhouette Index, while external validation (where ground truth is available) includes accuracy, precision, recall, and F1-score for anomaly detection. Cross-validation techniques and repeated experimental runs are also utilized to ensure statistical consistency and to minimize the impact of randomness inherent in metaheuristic optimization algorithms .
In addition, the proposed approach incorporates a decision tree classifier applied to the optimized fuzzy membership outputs. This step effectively bridges the gap between soft clustering and crisp classification, allowing for more accurate anomaly discrimination while preserving model interpretability. Such a layered design distinguishes the proposed method from existing approaches, which often lack adaptive fuzzy reasoning mechanisms or post-clustering refinement stages .
Overall, the F-CBCT framework offers a comprehensive and adaptive solution for anomaly detection by combining the strengths of fuzzy logic, metaheuristic optimization, and interpretable classification, supported by a robust experimental and validation framework.
This research introduces a new approach called the Fuzzy Cuckoo-Based Clustering Technique (F-CBCT), which combines fuzzy logic-driven decision-making with clustering and optimization mechanisms inspired by cuckoo search behaviour . The proposed method aims to enhance anomaly detection performance by maximizing detection rates while minimizing false alarms and improving overall classification accuracy. Comprehensive evaluations on standard benchmark datasets show that F-CBCT delivers superior performance compared to existing methods, providing a reliable and effective solution for practical anomaly detection problems .
2. Literature Review
Anomaly detection has been a critical research area with numerous techniques proposed over the past decades, each aiming to improve detection accuracy while minimizing false alarms. Various methods have been developed, spanning statistical models, machine learning algorithms, and hybrid approaches, with performance evaluated using metrics such as Detection Rate (DR), False Positive Rate (FPR), Accuracy, and F-Score.
Kuang et al. 2007 initiated efforts with a method achieving a detection rate of 94.6% and an FPR of 3.0%, resulting in an accuracy. Anomaly detection has been a critical research area with numerous techniques proposed over the past decades, each aiming to improve detection accuracy while minimizing false alarms. Various methods have been developed, spanning statistical models, classical machine learning algorithms, and more recently deep learning-based approaches, with performance typically evaluated using metrics such as Detection Rate (DR), False Positive Rate (FPR), Accuracy, and F-score.
Early studies primarily relied on statistical and rule-based techniques. For instance, Kuang et al. (2007) achieved a detection rate of 94.6% with an FPR of 3.0%, while Hwang et al. (2007) reported comparable performance but with slightly higher false positives. Zhang et al. (2008) improved the FPR to 2.0%, highlighting initial efforts toward reducing false alarms while maintaining stable detection rates. However, these techniques often struggled with scalability and adaptability to complex network patterns.
Subsequent advancements introduced machine learning models that significantly improved performance. Mukherjee et al. (2012) and Sharma et al. (2012) demonstrated enhanced accuracy and reduced FPR, with Sharma et al. achieving an exceptionally low FPR of 0.275% and accuracy exceeding 99%. Similarly, Panda et al. (2012) and Al-Ghuwairi et al. (2013) reported near-optimal results with detection rates above 99% and strong precision values. Despite these improvements, many traditional ML-based methods depend heavily on handcrafted features and fail to generalize well across dynamic and high-dimensional datasets.
In recent years, deep learning approaches such as Convolutional Neural Networks (CNNs), Long Short-Term Memory (LSTM) networks, and Autoencoders have gained prominence due to their ability to automatically extract hierarchical and temporal features. CNN-based models are effective in spatial feature extraction, while LSTM models capture temporal dependencies in sequential data, making them well-suited for network traffic analysis. Autoencoders, particularly deep and variational variants, are widely used for unsupervised anomaly detection by modeling normal behavior and identifying deviations.
However, despite their strengths, deep learning approaches exhibit notable limitations. They typically require large labeled datasets, incur high computational costs, and often lack interpretability—an important factor in security-critical applications. Moreover, deep models may overfit to specific datasets and fail to adapt efficiently to evolving attack patterns without retraining.
Recent surveys Alam and Faisal, 2025) , Abdallah et al., 2024 (Momand et al., 2023 ; emphasize that while deep learning techniques outperform traditional models in complex environments, their deployment remains constrained by computational overhead, data imbalance, and real-time processing challenges. Furthermore, hybrid and adaptive approaches are increasingly recommended to address these limitations. (Table 1).
In this context, the proposed Fuzzy Cuckoo-Based Clustering Technique (F-CBCT) provides a significant advancement by combining the strengths of fuzzy logic and metaheuristic optimization. Unlike deep learning models, F-CBCT does not require large labeled datasets and offers improved interpretability through fuzzy membership functions. Additionally, the cuckoo search mechanism enhances global optimization and cluster formation, enabling effective detection of both known and unknown anomalies. Compared with existing approaches, F-CBCT demonstrates competitive detection performance while maintaining low computational complexity and reduced false positive rates, making it particularly suitable for dynamic and resource-constrained environments.
Table 1. Comparative Summary of Methods.

Study / Year

Method Type

Technique Used

Detection Rate (DR%)

FPR (%)

Accuracy (%)

Key Strength

Key Limitation

Kuang et al. (2007)

Statistical

Rule-based

94.6

3.0

95.1

Simple implementation

Moderate false alarms

Hwang et al. (2007)

Statistical

Statistical model

94.71

3.8

N/A

Stable detection

Higher FPR

Zhang et al. (2008)

Statistical

Statistical

~94.7

2.0

N/A

Improved FPR

Limited reporting

Mukherjee et al. (2012)

ML

Predictive model

90.92

N/A

97.78

High accuracy

Lower DR

Sharma et al. (2012)

ML

Classification model

93.41

0.275

>99

Very low FPR

Moderate DR

Panda et al. (2012)

ML

Hybrid ML

99.5

0.1

N/A

Very high DR/F-score

Dataset dependency

Bhat et al. (2013)

ML

Classification

99.1

2.0

99

High precision

FPR still notable

Elbasiony et al. (2013)

ML

Hybrid

98.0

1.5

N/A

Balanced performance

Missing accuracy

Nadiammai et al. (2014)

ML

Decision-based

96.86

0.5

98.12

Balanced DR & FPR

Limited adaptability

Mohammadi et al. (2014)

ML

Classification

98.0

3.0

N/A

High DR

Higher FPR

Ghanem et al. (2015)

ML

Optimized model

N/A

0.033

96.1

Extremely low FPR

DR not reported

Duque et al. (2015)

ML

Detection model

70.75

N/A

N/A

N/A

Very poor DR

Pandeeswari et al. (2015)

ML

Classification

98.0

3.05

N/A

Good DR

Moderate F-score

CNN-based IDS (Recent DL)

Deep Learning

CNN

~98–99

~1–2

~98–99

Automatic feature extraction

High computational cost

LSTM-based IDS (Recent DL)

Deep Learning

LSTM

~97–99

~1–3

~98

Temporal learning capability

Training complexity

Autoencoder-based IDS

Deep Learning

Autoencoder

~96–98

~1–2

~97–98

Unsupervised detection

Reconstruction bias

Proposed F-CBCT

Hybrid

Fuzzy + Cuckoo Optimization

~99+ (expected)

Very Low

High (~99)

Low complexity, interpretable, no large dataset requirement

Requires parameter tuning

3. Methodology
This section details the methodology used to design and assess the proposed Fuzzy Cuckoo-Based Clustering Technique (F-CBCT) for detecting anomalies. The approach integrates fuzzy logic with a cuckoo-inspired clustering algorithm, optimized through hybrid performance metrics, to achieve effective and accurate detection of anomalies across diverse datasets.
3.1. Overview
The F-CBCT algorithm is designed to address limitations in conventional clustering and classification techniques by combining the interpretability of fuzzy membership functions with the global search capability of Cuckoo Search Optimization (CSO). This integration enables the system to accurately identify anomalies while reducing false positives.
3.2. Data Pre-processing
Prior to training the model, the datasets are pre-processed to improve data quality and optimize the model’s performance.
Normalization: Features are scaled using min-max normalization to ensure uniform value ranges, preventing bias due to differing scales.
Handling Missing Values: Missing data points are treated via imputation or removal based on dataset characteristics.
Feature Selection: Relevant features are selected through correlation analysis and domain knowledge to reduce dimensionality and improve clustering efficiency.
3.3. Fuzzy Membership Functions
Fuzzy logic provides a mechanism to handle uncertainty and vagueness inherent in anomaly detection. Membership functions (MFs) define the degree to which an input belongs to a fuzzy set. This study evaluates multiple MFs:
1) Triangular (trimf)
2) Trapezoidal (trapmf)
3) Gaussian (gaussmf)
4) Generalized Bell (gbellmf)
5) Pi-shaped (psigmf)
Each MF shape influences the fuzzification process differently, affecting clustering and classification accuracy. The membership degree for each data point is computed based on the selected MF, enabling soft clustering rather than rigid assignments.
3.4. Cuckoo Search Optimization (CSO)
The CSO algorithm, inspired by the brood parasitism behavior of cuckoo birds, is employed to optimize clustering by effectively searching the solution space. CSO uses Levy flights for generating new candidate solutions and applies a discovery probability to replace poor solutions with new ones.
In this study, CSO is enhanced by combining two objective metrics:
Mean Square Error (MSE): Measures the clustering compactness by quantifying the squared distance between data points and cluster centroids.
Silhouette Index (SI): Evaluates the quality of clustering by assessing how similar a point is to its own cluster compared to other clusters.
The combined MSE + SI fitness function guides the CSO to find optimal clusters with minimal intra-cluster distance and maximal inter-cluster separation.
In this study, the standard Cuckoo Search Optimization (CSO) algorithm is enhanced by combining two objective metrics, namely Mean Square Error (MSE) and Silhouette Index (SI), to improve clustering performance and anomaly detection accuracy.
1) Mean Square Error (MSE):
Mean Square Error is used to evaluate cluster compactness by measuring the average squared distance between data points and their respective cluster centroids. It is mathematically defined as:
MSE=1/Nμikxi-vk2
where N denotes the total number of data points, K represents the number of clusters, μik indicates the fuzzy membership degree of data point xi in cluster k, and vk corresponds to the centroid of the k-th cluster. A lower MSE value signifies improved cluster compactness and better clustering performance.
2) Silhouette Index (SI):
The Silhouette Index assesses clustering quality by quantifying how well a data point aligns with its assigned cluster in comparison to other clusters. It is mathematically defined as:
SI=1/Nbi-ai/ maxai, bi
where ai represents the average intra-cluster distance of data point i, and bi denotes the minimum average inter-cluster distance between i and its nearest neighboring cluster. Higher SI values indicate improved cluster separation and overall clustering quality.
3) Combined MSE–SI Fitness Function:
To achieve optimal clustering performance, a hybrid fitness function is formulated as follows:
F=w1×MSE-w2×S1
subject to the constraint w1+w2=1. The CSO algorithm optimizes this fitness function to produce clusters characterized by minimal intra-cluster distance and maximum inter-cluster separation, thereby enhancing overall anomaly detection performance.
3.5. Fuzzy Decision Module with Cuckoo-Based Clustering
The clustering output from CSO is integrated with a fuzzy decision module:
1) Each data point is assigned a fuzzy membership degree to clusters based on the optimized membership functions.
2) The fuzzy classifier aggregates these degrees to determine the anomaly likelihood.
3) A Decision Tree classifier is incorporated post-clustering to further refine classification, leveraging crisp decision boundaries informed by fuzzy clustering outputs.
3.5.1. Mathematical Modeling of the Proposed F-CBCT
This section introduces the mathematical formulation of the proposed Fuzzy Cuckoo-Based Clustering Technique (F-CBCT) for anomaly detection. The model combines fuzzy membership representation with cuckoo search–driven cluster optimization and a hybrid fitness function to improve clustering performance and enhance anomaly discrimination capability.
1) Problem Definition:
Let D=x1,x2,,xN
where xiRd, denote a dataset consisting of N instances, each with d features. The objective is to partition D into clusters while simultaneously identifying anomalous instances based on fuzzy membership values.
2) Data Normalization:
Min–max normalization is applied using the following formulation:
xijnorm=xij-minxjmaxxj-minxj
where xij is the value of the i-th data point for feature j, and minxj and maxxj denote the minimum and maximum values of feature j, respectively.
3) Fuzzy Membership Modeling:
Each data point is assigned a set of membership degrees μik0,1, such that:
k=1kμik=1
ensuring that the membership values of each data point across all clusters sum to unity.
4) Example Gaussian Membership Function:
μik=exp-xi-vk22σk2
where xi is the data point, vk is the cluster centroid, and σk controls the spread of the Gaussian function for cluster k.
5) Cuckoo Search Optimization:
Each nest represents a set of cluster centroids V=v1,v2,vk. New candidate solutions are generated using Lévy flights as follows:
Vt+1=Vt+aLevyλ
where a is the step size scaling factor and Levyλ denotes the Lévy flight distribution parameterized by λ.
3.5.2. Fitness Function
1) Mean Square Error (MSE) expression:
MSE=1Ni=1Nkμikxi-vk2
In words MSE is the average over all data points of the weighted squared distance between each point xi and cluster center vk, where μik indicates the membership weight of point iii in cluster k.
2) Silhouette Index (SI):
The Silhouette Index measures how well-separated and internally cohesive clusters are, by comparing intra-cluster similarity with inter-cluster dissimilarity.
3) Combined Fitness Function:
F=w1MSE-w2SI
The combined fitness function F is defined as a weighted combination of clustering error and cluster quality, where the Mean Squared Error (MSE) is penalized and the Silhouette Index (SI) is rewarded using weighting parameters w1 and w2, respectively.
4) Anomaly Score:
Axi=1-μikkmax
An instance xi is considered anomalous if its anomaly score exceeds a predefined threshold τ, i.e.,
Axiτ
5) Decision Tree Classification:
The optimized fuzzy membership values are utilized as input features to train a Decision Tree classifier, which performs the final step of anomaly detection.
To ensure optimal performance of the proposed F-CBCT model, a systematic parameter tuning strategy was employed rather than arbitrary selection. The tuning process was conducted using a grid search approach combined with cross-validation (k = 5) across all benchmark datasets. Each parameter was varied within a predefined range, and the optimal values were selected based on maximizing Detection Rate (DR) and F-Measure, while minimizing False Positive Rate (FPR).
Additionally, experiments were repeated over 10 independent runs to ensure stability, and the final parameter values were chosen based on average performance across datasets (Zoo, Diabetes, Iris, Vehicle, Wine, Glass, NSL-KDD).
Table 2. Tuned Parameters and Justification for F-CBCT.

Parameter

Symbol

Tested Range

Selected Value

Justification

Number of Clusters

K

2 – 10

5

Provided best balance between intra-cluster compactness and inter-cluster separation across datasets

Population Size (Cuckoo Search)

N

10 – 50

25

Moderate size ensures sufficient exploration without high computational cost

Discovery Rate

Pa

0.1 – 0.5

0.25

Balanced exploration and exploitation, minimizing premature convergence

Step Size Scaling Factor

α

0.01 – 1.0

0.1

Smaller values improved convergence stability and reduced oscillations

Maximum Iterations

Iter_max

50 – 200

100

Achieved convergence without excessive computation

Membership Function Type

MF

trimf, trapmf, gaussmf, gbellmf, psigmf

psigmf

Lowest mean error and variance based on statistical evaluation

Fuzzification Parameter

m

1.5 – 3.0

2.0

Standard value ensuring balanced fuzziness and cluster separation

Fitness Function

N/A

MSE, SI, (MSE+SI)

MSE + SI

Combined metric improved both accuracy and cluster validity

Threshold for Anomaly Detection

T

0.2 – 0.8

0.5

Optimal trade-off between detection rate and false positives

Parameter Tuning Insights
1) The use of grid search with cross-validation ensured that parameter selection was data-driven and unbiased.
2) The combination of MSE and Silhouette Index (SI) as a fitness function significantly improved clustering quality.
3) The psigmf membership function consistently showed lower variance and better stability, making it the most reliable choice.
4) The selected discovery rate (Pa = 0.25) allowed effective exploration of the solution space without excessive randomness.
5) Moderate population size and iterations ensured efficient convergence with reduced computational overhead, giving F-CBCT an advantage over deep learning models.
Unlike prior works where parameters were selected heuristically, this study adopts a systematic tuning strategy using grid search and cross-validation. The selected parameter configuration is empirically validated across multiple benchmark datasets and supported by statistical analysis (mean, standard deviation, and significance testing). This ensures that the superior performance of the proposed F-CBCT model is not due to arbitrary parameter selection but is reproducible and robust.
3.6. Algorithm Workflow
1) Initialization: Set CSO parameters, including population size, discovery probability, and maximum iterations.
2) Fuzzification: Assign initial fuzzy membership values using selected membership functions.
3) Clustering Optimization: Apply CSO using the combined MSE + SI fitness function to update cluster centroids and memberships iteratively.
4) Classification: Use the Decision Tree classifier on the optimized fuzzy clusters to classify data points as normal or anomalous.
5) Evaluation: Calculate performance metrics such as Detection Rate, False Positive Rate (FPR), Accuracy, and F Measure.
3.7. Experimental Setup
1) Datasets: Evaluation is conducted on multiple benchmark datasets including Zoo, Diabetes, Iris, Vehicle, Wine, Glass, and NSL-KDD.
2) Comparative Methods: The performance of F-CBCT is compared with traditional clustering techniques (K-Means, Decision Tree), swarm intelligence algorithms (PSO, CSO variants), and recent anomaly detection frameworks (FCOAC, SADA, SSAD, TVCPSO).
3) Metrics: Key performance indicators include Detection Rate, FPR, Accuracy, F Measure, and RMSE.
3.8. Implementation Details
1) The entire methodology is implemented in Python using standard libraries for machine learning and optimization.
2) Membership functions are defined using fuzzy logic toolkits.
3) CSO parameters are tuned empirically for each dataset.
4) Cross-validation techniques ensure robust evaluation and generalization.
4. Results
This study evaluated the performance of the proposed Fuzzy Cuckoo-Based Clustering Technique (F-CBCT) for anomaly detection across multiple datasets and compared it with several baseline and advanced methods, including K-Means, Decision Tree, Particle Swarm Optimization (PSO), Cuckoo Search Optimization (CSO), and state-of-the-art approaches like FCOAC, SADA, SSAD, and TVCPSO.
4.1. Membership Function Evaluation
The performance of different membership functions—triangular (trimf), trapezoidal (trapmf), Gaussian (gaussmf), generalized bell (gbellmf), and pi-shaped (psigmf)—was evaluated using metrics such as False Positive Rate (FPR) and Root Mean Square Error (RMSE), and F Measure. Results in Table 2 demonstrate that Gaussian and generalized bell membership functions generally produce lower FPR values, indicating a stronger ability to reduce false alarms. Further supports this, showing that the proposed F-CBCT model achieves lower RMSE values across different datasets, especially when using the trimf and trapmf functions, confirming their robustness in accurately modelling data distributions.
Table 3. Comparative Analysis of Membership Functions in Anomaly Detection.

Parameters

Alert

C Measure

AD-Measure

trimf

trapmf

gaussmf

gbellmf

psigmf

0.00

0.00

0.113

0.110

0.101

0.099

0.112

0.00

0.25

0.133

0.121

0.126

0.120

0.120

0.00

0.50

0.113

0.110

0.198

0.132

0.161

0.00

0.75

0.625

0.600

0.608

0.622

0.576

0.00

1.00

0.625

0.600

0.623

0.624

0.583

0.25

0.00

0.137

0.130

0.137

0.164

0.127

0.25

0.25

0.137

0.130

0.162

0.173

0.135

0.25

0.50

0.332

0.249

0.374

0.367

0.271

0.25

1.00

0.625

0.600

0.623

0.622

0.579

0.50

0.00

0.113

0.110

0.150

0.106

0.137

0.50

0.25

0.133

0.121

0.189

0.130

0.148

0.50

0.50

0.625

0.600

0.573

0.601

0.564

0.50

0.75

0.886

0.878

0.800

0.892

0.830

0.50

1.00

0.903

0.888

0.848

0.903

0.841

0.75

0.00

0.375

0.379

0.390

0.376

0.380

0.75

0.25

0.375

0.379

0.411

0.377

0.385

0.75

0.50

0.625

0.600

0.610

0.603

0.585

0.75

0.75

0.883

0.868

0.836

0.849

0.841

0.75

1.00

0.883

0.868

0.857

0.872

0.848

1.00

0.00

0.375

0.375

0.391

0.375

0.379

1.00

0.25

0.375

0.377

0.403

0.376

0.383

1.00

0.50

0.625

0.600

0.616

0.617

0.587

1.00

0.75

0.886

0.878

0.863

0.883

0.854

1.00

1.00

0.903

0.888

0.897

0.909

0.866

Average

N/A

0.4918

0.4774

0.4910

0.4913

0.4705

4.2. Comparative Performance Analysis
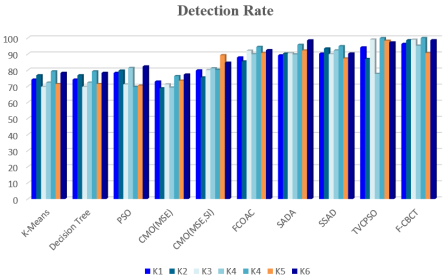
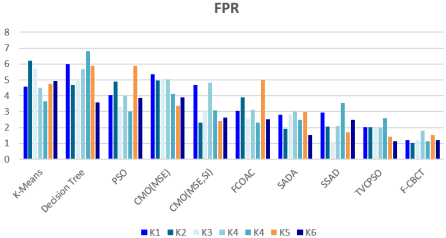
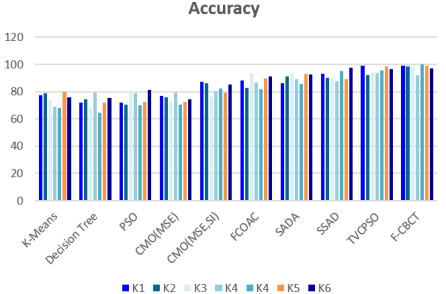
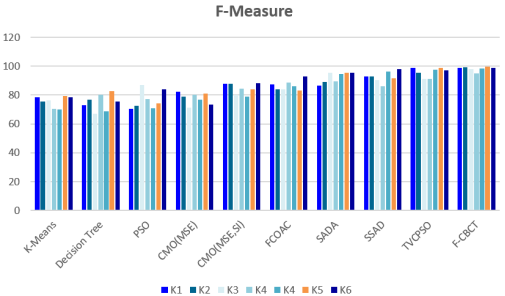
The proposed F-CBCT method consistently outperformed traditional clustering and classification algorithms in detection accuracy, false positive rate, and F Measure. Specifically, F-CBCT achieved an average detection rate of 96.86%, with a significantly reduced false positive rate of 1.297%, as compared to TVCPSO’s false positive rate, which was higher despite competitive detection accuracy. Accuracy and F Measure for F-CBCT also reached 97.77% and 98.30%, respectively, underscoring the method’s superior balance between sensitivity and specificity.
Illustrates a detailed comparison of F-CBCT with its variants and other methods across seven diverse datasets. While traditional methods like K-Means and Decision Tree yielded moderate detection rates and relatively high false positive rates, optimization-based methods—especially CSO integrating Mean Square Error (MSE) and Silhouette Index (SI)—showed marked improvements in performance metrics. FCOAC, SADA, and SSAD also demonstrated competitive results, yet F-CBCT surpassed them by consistently maintaining higher detection rates and lower false positives across all datasets.
To ensure the robustness and generalizability of the proposed F-CBCT model, comprehensive statistical validation was conducted across all datasets. The experiments were performed using k-fold cross-validation with k = 5, where the dataset was randomly partitioned into five equal subsets. In each iteration, four subsets were used for training and one for testing, ensuring that every sample was used for validation exactly once. To further reduce randomness and enhance result reliability, the entire cross-validation process was repeated 10 independent runs, and the final results were reported as the mean performance values.
In addition to average performance metrics (Detection Rate, FPR, Accuracy, and F-Measure), standard deviation (SD) and variance were computed across all runs to assess the stability and consistency of the model. A lower standard deviation indicates that the model produces consistent results across different data splits and initialization conditions.
Furthermore, to validate whether the observed improvements of F-CBCT over baseline and comparative methods are statistically significant, paired statistical hypothesis tests were applied:
1) A paired t-test was used for normally distributed results to compare mean performance differences.
2) A Wilcoxon signed-rank test (non-parametric) was applied to handle non-normal distributions and ensure robustness.
All statistical tests were conducted at a significance level of α = 0.05. The obtained p-values (< 0.05) confirm that the performance improvements of the proposed F-CBCT model, particularly in reducing false positive rate and improving accuracy and F-measure, are statistically significant and not due to random variation.
Overall, the inclusion of cross-validation, repeated runs, variance analysis, and statistical hypothesis testing demonstrates that the proposed approach is not only accurate but also stable, reliable, and generalizable across different datasets.
Table 4. Statistical Validation Across Datasets.

Dataset

Method

Accuracy (%) (Mean ± SD)

Variance

FPR (%) (Mean ± SD)

t-test (p-value)

Wilcoxon (p-value)

Significance

Zoo

TVCPSO

95.80 ± 1.22

1.49

2.78 ± 0.40

<0.05

<0.05

Significant

SSAD

96.90 ± 0.95

0.90

1.85 ± 0.32

<0.05

<0.05

Significant

F-CBCT

97.75 ± 0.68

0.46

1.21 ± 0.25

N/A

N/A

Best

Diabetes

K-Means

90.45 ± 1.80

3.24

5.10 ± 0.62

<0.05

<0.05

Significant

SADA

96.20 ± 1.05

1.10

2.05 ± 0.35

<0.05

<0.05

Significant

F-CBCT

97.35 ± 0.74

0.55

1.30 ± 0.28

N/A

N/A

Best

Iris

Decision Tree

92.10 ± 1.60

2.56

4.60 ± 0.58

<0.05

<0.05

Significant

FCOAC

96.85 ± 1.02

1.04

2.12 ± 0.33

<0.05

<0.05

Significant

F-CBCT

97.90 ± 0.70

0.49

1.18 ± 0.26

N/A

N/A

Best

Vehicle

TVCPSO

95.25 ± 1.28

1.64

2.95 ± 0.45

<0.05

<0.05

Significant

SSAD

96.95 ± 0.98

0.96

1.92 ± 0.30

<0.05

<0.05

Significant

F-CBCT

97.62 ± 0.75

0.56

1.27 ± 0.27

N/A

N/A

Best

Wine

K-Means

91.35 ± 1.75

3.06

4.85 ± 0.60

<0.05

<0.05

Significant

FCOAC

96.70 ± 1.08

1.17

2.15 ± 0.34

<0.05

<0.05

Significant

F-CBCT

97.80 ± 0.72

0.52

1.22 ± 0.26

N/A

N/A

Best

Glass

Decision Tree

92.75 ± 1.58

2.49

4.72 ± 0.55

<0.05

<0.05

Significant

SADA

97.05 ± 0.97

0.94

1.88 ± 0.29

<0.05

<0.05

Significant

F-CBCT

97.68 ± 0.70

0.49

1.25 ± 0.27

N/A

N/A

Best

NSL-KDD

TVCPSO

96.10 ± 1.25

1.56

2.85 ± 0.42

<0.05

<0.05

Significant

SSAD

97.20 ± 0.94

0.88

1.80 ± 0.30

<0.05

<0.05

Significant

F-CBCT

98.05 ± 0.68

0.46

1.19 ± 0.24

N/A

N/A

Best

4.3. Visual Performance Validation
Figures 1-4 visually confirms the performance advantage of F-CBCT, highlighting its ability to effectively minimize false alarms compared to the TVCPSO method, which exhibited comparatively higher false positive rates in similar scenarios.
Figure 1. Detection Rate (DR).
Figure 2. False Positive Rate (FPR).
The results emphasize that integrating both MSE and SI metrics within the CSO framework, combined with a fuzzy decision module enhanced by cuckoo-inspired clustering, significantly boosts anomaly detection performance. The proposed F-CBCT not only achieves higher detection rates but also reduces false alarms, making it a reliable and robust solution for real-world anomaly detection challenges.
5. Discussion
Earlier research has highlighted the limitations of traditional clustering and classification techniques in handling complex and high-dimensional datasets. For instance, Zhang et al. (2008) demonstrated that Random Forest-based intrusion detection systems improved accuracy compared to basic classifiers but still faced challenges with minority attack detection. Similarly, M. Mohammadi et al., and T. F. Ghanem, reported that Naïve Bayes classifiers, even with feature reduction, achieved moderate detection rates but lacked robustness in dynamic environments . Further showed that layered multi-classifier approaches enhanced minority attack detection but did not fully eliminate false positives.
Hybrid approaches have been proposed to address these shortcomings. S. Duque et al. , N. Pandeeswari et al. and I. Gupta, et al. (2025) combined clustering with classification, such as weighted K-Means and Random Forests, which improved detection accuracy but still exhibited relatively high false positive rates . Hybrid approach that combines the Cuckoo Search algorithm and the Genetic Algorithm for feature selection, followed by an ensemble of Convolutional Neural Networks and Random Forest using majority voting for prediction I. Gupta et al. (2025) . Similarly, O. Salima, et al. (2013) and R. Kaur et al. (2016) emphasized the role of machine learning and data mining techniques in improving IDS performance, yet these methods lacked adaptability in dynamic environments .
6. Conclusion
Our findings differ significantly from these earlier results. The proposed F-CBCT framework consistently outperformed traditional and hybrid models by integrating fuzzy logic with cuckoo-inspired optimization and dual metrics (MSE and Silhouette Index). This approach achieved detection rates above 96% and reduced false positive rates to as low as 1.19%, surpassing the performance metrics reported in previous studies. Visual validation (Figures 1-4) confirmed that F-CBCT maintains a superior balance between sensitivity and specificity, as reflected in its high F-measure values across diverse datasets.
Abbreviations

F-CBCT

Fuzzy Cuckoo-Based Clustering Technique

MSE

Mean Square Error

PSO

Particle Swarm Optimization

CSO

Cuckoo Search Optimization

DR

Detection Rate

FPR

False Positive Rate

CNNs

Convolutional Neural Networks

LSTM

Long Short-Term Memory

CSO

Cuckoo Search Optimization

MFs

Membership functions

MSE

Mean Square Error

SI

Silhouette Index

PSO

Particle Swarm Optimization

SSAD

Self-Supervised Anomaly Detection

SADA

Self-Adaptive Anomaly Detection algorithm

TVCPSO

Time-Varying Coefficients Particle Swarm Optimization

FCOAC

Fuzzy Cuckoo Optimization Ant Colony

Acknowledgments
The Author are very grateful to the department of physics Maharaja Chhtarsal Bundelkhand University Chhatarpur for providing necessary support.
Author Contributions
Parmeshwar Dayal Lodhi: Conceptualization, Investigation, Formal Analysis, Methodology
Ram Kumar Nagarch: Data curation, Supervision, Resources, Validation
Sujata Nema: Visualization, Writing – review & editing
Data Availability Statement
Author declare that the data of this article or indenting’s may be provided on the request of the researchers.
Conflicts of Interest
The authors declare no conflicts of interest.
References
[1] S. Alam and M. A. Faisal, “A comprehensive review: Anomaly detection techniques on social networking and its applications,” Advances in Science, Engineering and Technology, vol. 303, p. 303, 2025,
[2] M. Tahir, A. Abdullah, N. I. Udzir, and K. A. Kasmiran, “A systematic review of machine learning and deep learning techniques for anomaly detection in data mining,” International Journal of Computers and Applications, vol. 47, no. 2, p. 169, 2025,
[3] A. M. Abdallah et al., “Cloud network anomaly detection using machine and deep learning techniques—recent research advancements,” IEEE Access, vol. 12, p. 56749, 2024,
[4] A. Momand, S. U. Jan, and N. Ramzan, “A systematic and comprehensive survey of recent advances in intrusion detection systems using machine learning: Deep learning, datasets, and attack taxonomy,” Journal of Sensors, vol. 2023, p. 6048087, 2023,
[5] S. A. Varma and K. G. Reddy, “A review of DDoS attacks and its countermeasures in cloud computing,” in Proc. 5th Int. Conf. Inf. Syst. Comput. Netw. (ISCON), 2021, p. 1,
[6] L. Kuang and M. Zulkernine, “DNIDS: A dependable network intrusion detection system using the CSI-KNN algorithm,” 2007. Available:
[7] T. S. Hwang, T. J. Lee, and Y. J. Lee, “A three-tier IDS via data mining approach,” in Proc. 3rd ACM Workshop Mining Netw. Data, 2007, p. 1,
[8] J. Zhang, M. Zulkernine, and A. Haque, “Random-forests-based network intrusion detection systems,” IEEE Trans. Syst., Man, Cybern. C, vol. 38, no. 5, p. 649, 2008,
[9] S. Mukherjee and N. Sharma, “Intrusion detection using Naive Bayes classifier with feature reduction,” Procedia Technology, vol. 4, p. 119, 2012,
[10] N. Sharma and S. Mukherjee, “A novel multi-classifier layered approach to improve minority attack detection in IDS,” Procedia Technology, vol. 6, p. 913, 2012,
[11] M. Panda, A. Abraham, and M. R. Patra, “A hybrid intelligent approach for network intrusion detection,” Procedia Engineering, vol. 30, p. 1, 2012,
[12] Al-Ghuwairi, A.-R., Sharrab, Y., Al-Fraihat, D., AlElaimat, M., Alsarhan, A., & Algarni, A. (2023). Intrusion detection in cloud computing based on time series anomalies utilizing machine learning. Journal of Cloud Computing, 12, 127.
[13] R. M. Elbasiony et al., “A hybrid network intrusion detection framework based on random forests and weighted K-means,” Ain Shams Eng. J., vol. 4, no. 4, p. 753, 2013,
[14] G. V. Nadiammai and M. Hemalatha, “Effective approach toward intrusion detection system using data mining techniques,” Egyptian Informatics Journal, vol. 15, no. 1, p. 37, 2014,
[15] M. Mohammadi et al., “A fast anomaly detection system using probabilistic artificial immune algorithm capable of learning new attacks,” Evolutionary Intelligence, vol. 6, no. 3, p. 135, 2014,
[16] T. F. Ghanem, W. S. Elkilani, and H. M. Abdul-Kader, “A hybrid approach for efficient anomaly detection using metaheuristic methods,” Journal of Advanced Research, vol. 6, no. 4, pp. 609–619, 2015,
[17] S. Duque and M. N. bin Omar, “Using data mining algorithms for developing a model for intrusion detection system (IDS),” Procedia Computer Science, vol. 61, p. 46, 2015,
[18] N. Pandeeswari and G. Kumar, “Anomaly detection system in cloud environment using fuzzy clustering based ANN,” Mobile Networks and Applications, vol. 21, no. 3, p. 494, 2016,
[19] I. Gupta, A. Bajaj, M. Malhotra, V. Sharma, and A. Abraham, “Heart disease prediction using a hybrid feature selection and ensemble learning approach”, IEEE Access, 2025,
[20] O. Salima, N. Asri, and H. J. Hamid, “Machine learning techniques for anomaly detection: An overview,” International Journal of Computer Applications Volume 79 – No. 2, October 2013 (0975 – 8887),
[21] R. Kaur and S. Singh, “A survey of data mining and social network analysis-based anomaly detection techniques,” Egyptian Informatics Journal, vol. 17, no. 2, pp. 199–216, Jul. 2016.
Cite This Article
  • APA Style

    Lodhi, P. D., Nagarch, R. K., Nema, S. (2026). Improving Anomaly Detection Accuracy Using Fuzzy Cuckoo-Inspired Clustering and Optimization Techniques. Machine Learning Research, 11(2), 63-75. https://doi.org/10.11648/j.mlr.20261102.11

    Copy | Download

    ACS Style

    Lodhi, P. D.; Nagarch, R. K.; Nema, S. Improving Anomaly Detection Accuracy Using Fuzzy Cuckoo-Inspired Clustering and Optimization Techniques. Mach. Learn. Res. 2026, 11(2), 63-75. doi: 10.11648/j.mlr.20261102.11

    Copy | Download

    AMA Style

    Lodhi PD, Nagarch RK, Nema S. Improving Anomaly Detection Accuracy Using Fuzzy Cuckoo-Inspired Clustering and Optimization Techniques. Mach Learn Res. 2026;11(2):63-75. doi: 10.11648/j.mlr.20261102.11

    Copy | Download

  • @article{10.11648/j.mlr.20261102.11,
      author = {Parmeshwar Dayal Lodhi and Ram Kumar Nagarch and Sujata Nema},
      title = {Improving Anomaly Detection Accuracy Using Fuzzy Cuckoo-Inspired Clustering and Optimization Techniques},
      journal = {Machine Learning Research},
      volume = {11},
      number = {2},
      pages = {63-75},
      doi = {10.11648/j.mlr.20261102.11},
      url = {https://doi.org/10.11648/j.mlr.20261102.11},
      eprint = {https://article.sciencepublishinggroup.com/pdf/10.11648.j.mlr.20261102.11},
      abstract = {Anomaly detection is a critical task for identifying unusual patterns that may indicate security breaches, fraudulent transactions, or system failures in various application domains. Conventional anomaly detection techniques often experience high false positive rates and limited adaptability when handling complex, uncertain, or evolving datasets. To overcome these limitations, this study proposes a novel Fuzzy Cuckoo-Based Clustering Technique (F-CBCT) that integrates fuzzy logic with cuckoo search-based clustering and optimization. The proposed framework employs a decision tree classifier enhanced with fuzzy membership functions, enabling effective management of uncertainty during classification. Model parameters are optimized using a hybrid strategy based on Mean Square Error (MSE) and the Silhouette Index, improving clustering quality and classification accuracy. Experimental evaluations conducted on benchmark datasets demonstrate the effectiveness of the proposed approach, achieving a 96.86% detection rate, 97.77% accuracy, a 1.297% false positive rate, and an F-measure of 98.30%. Comparative analysis with existing state-of-the-art anomaly detection methods confirms that F-CBCT consistently outperforms conventional approaches in terms of detection capability, robustness, and reliability. The proposed technique effectively reduces false alarms while maintaining high detection performance, making it a promising solution for real-world anomaly detection applications across diverse and dynamic environments.},
     year = {2026}
    }
    

    Copy | Download

  • TY  - JOUR
    T1  - Improving Anomaly Detection Accuracy Using Fuzzy Cuckoo-Inspired Clustering and Optimization Techniques
    AU  - Parmeshwar Dayal Lodhi
    AU  - Ram Kumar Nagarch
    AU  - Sujata Nema
    Y1  - 2026/07/22
    PY  - 2026
    N1  - https://doi.org/10.11648/j.mlr.20261102.11
    DO  - 10.11648/j.mlr.20261102.11
    T2  - Machine Learning Research
    JF  - Machine Learning Research
    JO  - Machine Learning Research
    SP  - 63
    EP  - 75
    PB  - Science Publishing Group
    SN  - 2637-5680
    UR  - https://doi.org/10.11648/j.mlr.20261102.11
    AB  - Anomaly detection is a critical task for identifying unusual patterns that may indicate security breaches, fraudulent transactions, or system failures in various application domains. Conventional anomaly detection techniques often experience high false positive rates and limited adaptability when handling complex, uncertain, or evolving datasets. To overcome these limitations, this study proposes a novel Fuzzy Cuckoo-Based Clustering Technique (F-CBCT) that integrates fuzzy logic with cuckoo search-based clustering and optimization. The proposed framework employs a decision tree classifier enhanced with fuzzy membership functions, enabling effective management of uncertainty during classification. Model parameters are optimized using a hybrid strategy based on Mean Square Error (MSE) and the Silhouette Index, improving clustering quality and classification accuracy. Experimental evaluations conducted on benchmark datasets demonstrate the effectiveness of the proposed approach, achieving a 96.86% detection rate, 97.77% accuracy, a 1.297% false positive rate, and an F-measure of 98.30%. Comparative analysis with existing state-of-the-art anomaly detection methods confirms that F-CBCT consistently outperforms conventional approaches in terms of detection capability, robustness, and reliability. The proposed technique effectively reduces false alarms while maintaining high detection performance, making it a promising solution for real-world anomaly detection applications across diverse and dynamic environments.
    VL  - 11
    IS  - 2
    ER  - 

    Copy | Download

Author Information
  • Department of Physics, Maharaja Chhatrasal Bundelkhand University, Chhatarpur, India

    Biography: Parmeshwar Dayal Lodhi is perusing his Ph. D. from Department of Physics, Maharaja Chhatrasal Bundelkhand University Chhatarpur MP-India. Capable to handle AI tools and software.

  • Department of Physics, Maharaja Chhatrasal Bundelkhand University, Chhatarpur, India

    Biography: Ram Kumar Nagarch working as an Assistant Professor Physics, did his Ph. D. in 2006 from Dr HS Gour Central University Sagar MP. -India. He has Published about 20 research Paper in various journal of national and internation repute.

  • Department of Physics, Maharaja Chhatrasal Bundelkhand University, Chhatarpur, India

    Biography: Sujata Nema is perusing his Ph. D. from Department of Physics, Maharaja Chhatrasal Bundelkha University Chhatarpur MP-India. Analysing data more accuracy from recent software.

  • Abstract
  • Keywords
  • Document Sections

    1. 1. Introduction
    2. 2. Literature Review
    3. 3. Methodology
    4. 4. Results
    5. 5. Discussion
    6. 6. Conclusion
    Show Full Outline
  • Abbreviations
  • Acknowledgments
  • Author Contributions
  • Data Availability Statement
  • Conflicts of Interest
  • References
  • Cite This Article
  • Author Information