Background: Chemotherapy remains central to cancer management in sub-Saharan Africa but is frequently complicated by treatment resistance and cumulative hepato-renal toxicity. Longitudinal biomarker monitoring may improve early detection of subclinical organ dysfunction and therapeutic response. This study evaluated longitudinal changes in hepatic, renal, inflammatory, and tumor-associated biomarkers to elucidate chemotherapy response and resistance patterns among cancer patients receiving systemic therapy in Cameroon. Materials and Methods: A longitudinal observational study was conducted among 120 cancer patients treated at the Cameroon Oncology Centre (February-July 2025). Serum liver enzymes (aspartate aminotransferase (AST), alanine aminotransferase (ALT)), albumin, urea, creatinine-derived estimated glomerular filtration rate (eGFR), C-reactive protein (CRP) measurement was done once at the end of the chemotherapeutic period were measured at baseline and over three follow-up time points at two-month intervals, while cancer biomarkers, namely carcinoembryonic antigen (CEA), and cancer antigen 15-3 (CA15-3) were screened within two interval periods. Non-parametric analyses (Kruskal–Wallis, Friedman tests) assessed group differences and monotonic trends, while Spearman’s correlation evaluated treatment–biomarker associations. Results: Participants were predominantly female (77.5%), with advanced-stage disease (Stage III–IV: 59.2%). Liver enzymes remained largely stable throughout follow-up, indicating preserved hepatocellular integrity. In contrast, albumin exhibited a significant monotonic decline (−1.20%, p = 0.004), reflecting cumulative metabolic and inflammatory stress. Renal function showed a modest but significant decline in eGFR (−3.77%, p = 0.044), particularly among platinum-based regimens, despite stable urea levels. Tumour marker analysis revealed a pronounced and consistent reduction in CA15-3 (−12.98%, p = 0.006), whereas CEA showed no significant longitudinal trend. Drug-specific correlations supported time-dependent renal and hepatic effects, particularly with cisplatin and combination therapies. Conclusion: Longitudinal biomarker profiling reveals subclinical renal stress, systemic metabolic burden, and differential tumour marker responsiveness during chemotherapy. CA15-3 and eGFR emerged as sensitive indicators of treatment response and toxicity, underscoring the value of integrated biomarker monitoring in resource-limited oncology settings.
| Published in | Journal of Cancer Treatment and Research (Volume 14, Issue 1) |
| DOI | 10.11648/j.jctr.20261401.12 |
| Page(s) | 9-27 |
| Creative Commons |
This is an Open Access article, distributed under the terms of the Creative Commons Attribution 4.0 International License (http://creativecommons.org/licenses/by/4.0/), which permits unrestricted use, distribution and reproduction in any medium or format, provided the original work is properly cited. |
| Copyright |
Copyright © The Author(s), 2026. Published by Science Publishing Group |
Biomarkers, Cancer, Chemotherapy, Chemotherapy Resistance, Hepato-Renal Toxicity, CA15-3, CEA
Variable | Category | n (%) |
|---|---|---|
Sex | Male | 27 (22.5) |
Female | 93 (77.5) | |
Total | 120 (100) | |
Age (years) | ≥60 | 63 (52.5) |
<60 | 57 (47.5) | |
Cancer stage | Stage I–II | 22 (18.3) |
Stage III–IV | 71 (59.2) | |
Chemotherapy agents | Adriblastin | 13 (10.8) |
Cyclophosphamide | 21 (17.5) | |
Cysplastin | 24 (20.0) | |
5 Flu | 15 (15.5) | |
Carboplatin | 22 (18.3) | |
Transtuzumab | 6 (5.0) | |
Therapy type | Monotherapy | 32 (26.7) |
Bi-Therapy | 59 (47.2) | |
Tri-therapy | 19 (15.8) | |
Tetra-therapy | 10 (8.3) | |
Total | 120 (100.0) | |
Cancer types | Breast | 42 (35.0) |
Cervix | 31 (25.8) | |
Colorectum | 7 (5.8) | |
Head and neck | 7 (5.8) | |
Lung | 5 (4.2) | |
Nasopharyngeal | 9 (7.5) | |
Prostate | 11 (9.2) | |
Others | 8 (6.7) | |
Total | 120 (100.0) | |
Forms of cancer | Carcinoma | 116 (96.7) |
Sarcoma | 3 (2.5) | |
Triple negative | 1 (0.8) | |
Total | 120 (100.0) |
Biomarker | Average | T1 (Baseline) | T2 (3 months) | T3 (6 months) | P value |
|---|---|---|---|---|---|
AST (U/L) | 25.92 ± 11.72 | 26.54 ± 12.78a | 24.65 ± 11.65a | 26.57 ± 10.74a | 0.235 |
ALT (U/L) | 21.21 ± 11.93 | 20.45 ± 11.65a | 21.98 ± 12.38a | 21.20 ± 11.82a | 0.347 |
AST/ALT | 1.45 ± 1.33 | 1.45 ± 1.78a | 1.29 ± 1.17a | 1.61 ± 1.05a | 0.211 |
Albumin (g/L) | 30.20 ± 9.23 | 31.66 ± 8.37a | 28.36 ± 8.24a | 30.59 ± 11.07a | 0.305 |
Urea (mg/dL) | 33.39 ± 10.70 | 33.95 ± 10.88a | 33.79 ± 10.65a | 32.42 ± 10.56a | 0.634 |
eGFR (mL/min/1.73 m²) (CKD Stage) | 93.54 ± 21.31 | 125.50 ± 19.44a(Normal) | 121.52 ± 22.27a (Normal) | 122.61 ± 20.02a (Normal) | 0.764 |
Drug | Biomarkers | Average | T1 (At enrolment -Baseline) | T2 (After 3 months) | T3 (After 6 months) | P value |
|---|---|---|---|---|---|---|
Adriblastine (n=13) | Urea (mg/dL) | 33.39 ± 10.70 | 38.28 ± 9.01a | 26.47 ± 11.39a | 32.50 ± 9.36a | 0.091 |
eGFR (mL/min/1.73 m²) | 93.54 ± 21.31 | 90.60 ± 10.06b (Stage 1) | 76.64 ± 14.64a (Stage 2) | 75.35 ± 16.38a (Stage 2) | 0.001 | |
Cyclophosphamide (n=21) | Urea (mg/dL) | 33.39 ± 10.70 | 35.02 ± 9.10a | 27.97 ± 11.02a | 31.04 ± 10.90a | 0.321 |
eGFR (mL/min/1.73 m²) | 93.54 ± 21.31 | 89.06 ± 10.75a (Stage 2) | 79.49 ± 18.09a (Stage 2) | 76.22 ± 16.80a (Stage 2) | 0.072 | |
Cisplatin (n=24) | Urea (mg/dL) | 33.39 ± 10.70 | 34.30 ± 12.42a | 35.79 ± 9.60a | 34.73 ± 12.03a | 0.741 |
eGFR (mL/min/1.73 m²) | 93.54 ± 21.31 | 76.93 ± 17.11a (Stage 2) | 75.24 ± 22.66a (Stage 2) | 81.33 ± 16.53a (Stage 2) | 0.074 | |
5-Flu (n=15) | Urea (mg/dL) | 33.39 ± 10.70 | 30.36 ± 10.92a | 32.90 ± 12.20a | 36.77± 10.12a | 0.876 |
eGFR (mL/min/1.73 m²) | 93.54 ± 21.31 | 81.28 ± 18.45a (Stage 2) | 85.52 ± 18.74a (Stage 2) | 81.70 ± 26.00a (Stage 2) | 0.437 | |
Carboplatin (n=22) | Urea (mg/dL) | 33.39 ± 10.70 | 34.05 ± 11.88a | 32.35 ± 10.43a | 32.01 ± 10.44a | 0.765 |
eGFR (mL/min/1.73 m²) | 93.54 ± 21.31 | 88.65 ± 16.97a (Stage 2) | 81.49 ± 25.15a (Stage 2) | 78.01 ± 16.60a(Stage 2) | 0.132 | |
Transtuzumab (n=6) | Urea (mg/dL) | 33.39 ± 10.70 | 25.65 ± 7.35a | 30.25 ± 12.82b | 35.37 ± 13.31b | 0.002 |
eGFR (mL/min/1.73 m²) | 93.54 ± 21.31 | 97.88 ± 11.24a(Normal) | 93.00 ± 11.52a (Normal) | 105.35 ± 27.67a (Normal) | 0.589 | |
Adriblastine (n=13) | AST (U/L) | 25.92 ± 11.72 | 28.19 ± 9.36 | 25.02 ± 13.15 | 29.71 ± 8.52 | 0.998 |
ALT (U/L) | 21.21 ± 11.93 | 24.63 ± 12.76a | 22.09 ± 12.83a | 21.08 ± 11.29a | 0.678 | |
De Ritis ratio (AST/ALT) | 1.45 ± 1.33 | 1.33 ± 0.65a | 1.43 ± 0.96a | 1.68 ± 0.76a | 0.212 | |
Cyclophosphamide (n=21) | AST (U/L) | 25.92 ± 11.72 | 28.56 ± 8.53a | 26.77 ± 11.25a | 29.30 ± 8.56a | 0.112 |
ALT (U/L) | 21.21 ± 11.93 | 19.39 ± 12.22a | 24.18 ± 11.02a | 23.29 ± 10.78a | 0.321 | |
De Ritis ratio (AST/ALT) | 1.45 ± 1.33 | 2.12± 0.42b | 1.33 ± 0.17a | 1.53 ± 0.17ab | 0.035 | |
Cisplatin (n=24) | AST (U/L) | 25.92 ± 11.72 | 21.83 ± 6.86a | 23.43 ± 10.23a | 24.59 ± 10.29a | 0.411 |
ALT (U/L) | 21.21 ± 11.93 | 16.04± 9.23a | 21.19 ± 14.02b | 18.11± 12.06b | 0.042 | |
De Ritis ratio (AST/ALT) | 1.45 ± 1.33 | 1.05 ± 0.42a | 1.86 ± 0.26a | 1.05 ± 0.42a | 0.222 | |
5-Flu (n=15) | AST (U/L) | 25.92 ± 11.72 | 25.05 ± 8.44a | 28.01 ± 13.88a | 25.58 ± 7.42a | 0.212 |
ALT (U/L) | 21.21 ± 11.93 | 17.97 ± 8.61a | 23.53 ± 11.89b | 16.62 ± 8.40a | 0.004 | |
De Ritis ratio (AST/ALT) | 1.45 ± 1.33 | 1.71 ± 0.25a | 1.50 ± 0.19a | 1.93 ± 0.28a | 0.921 | |
Carboplatin (n=22) | AST (U/L) | 25.92 ± 11.72 | 24.52 ± 9.78a | 25.32± 10.85a | 25.40 ± 12.76a | 0.671 |
ALT (U/L) | 21.21 ± 11.93 | 19.28 ± 10.54a | 18.79 ± 12.39a | 19.13 ± 12.24a | 0.478 | |
De Ritis ratio (AST/ALT) | 1.45 ± 1.33 | 1.47 ± 0.58a | 1.64 ± 0.22a | 1.71 ± 0.27a | 0.989 | |
Transtuzumab (n=6) | AST (U/L) | 25.92 ± 11.72 | 25.80 ± 10.17a | 32.38 ± 17.33a | 33.65 ± 18.04a | 0.121 |
ALT (U/L) | 21.21 ± 11.93 | 21.13 ± 9.34a | 18.50 ± 4.82a | 22.78 ± 5.95a | 0.071 | |
De Ritis ratio (AST/ALT) | 1.45 ± 1.33 | 1.53 ± 0.38a | 2.11 ± 0.38a | 1.83 ± 0.57a | 0.056 |
Biomarker | Time 1 (After 3 months) | Time 2 (After 6 months) | p-value |
|---|---|---|---|
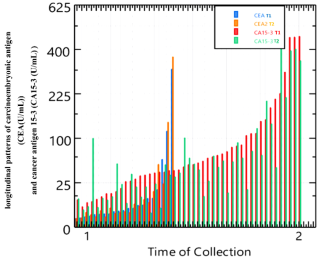
CEA (U/mL) | 4.12 (IQR: 2.28–12.21) | 4.10 (IQR: 2.30–14.25) | 0.545 |
CA15-3 (U/mL) | 49.49 (IQR: 27.00–106.6) | 41.80 (IQR: 12.11–73.30) | 0.004 |
Drugs | Albumin (g/L) | |||
|---|---|---|---|---|
T1 (At enrolment -Baseline) | T2 (After 3 months) | T3 (After 6 months) | P value | |
Average | 30.20 ± 9.23 | |||
Adriblastine (n=13) | 29.04 ± 3.11a | 28.85 ± 7.94a | 33.44 ± 7.28a | 0.345 |
Cyclophosphamide (n=21) | 31.39 ± 5.94a | 29.22 ± 7.13a | 31.88 ± 7.86a | 0.690 |
Cisplatin (n=24 | 34.39 ± 8.46a | 28.40 ± 8.82a | 33.30 ± 15.88a | 0.783 |
5-Flu (n=15) | 32.51 ± 7.68a | 29.14 ± 8.73a | 32.26 ± 13.19a | 0.135 |
Carboplatin (n=22 | 27.83 ± 7.15a | 25.93 ± 8.43a | 29.46 ± 9.96a | 0.246 |
Transtuzumab (n=6) | 29.02 ± 7.27b | 25.35 ± 5.53a | 31.90 ± 12.26b | 0.049 |
Drugs | CRP | CEA (U/mL) | CA15-3 (U/mL) | ||||
|---|---|---|---|---|---|---|---|
T1 (After 3 months) | T2 (After 6 months) | P | T1 (After 3 months) | T2 (After 6 months) | p | ||
Average | 21.64 ± 2.89 | 29.32 ± 16.83 | 84.73 ± 16.43 | ||||
Adriblastine (n=13) | 18.31 ± 7.59 | 27.45 ± 15.57a | 31.19 ± 18.09a | 0.094 | 74.77 ± 20.31a | 91.81 ± 35.85b | 0.001 |
Cyclophosphamide (n=21) | 21.00 ± 7.09 | 27.45 ± 15.57a | 31.19 ± 18.09a | 0.078 | 66.93 ± 14.11a | 74.62 ± 23.50a | 0.123 |
Cisplatin (n=24 | 16.75 ± 5.39 | 34.59 ± 31.27a | 39.72 ± 36.37a | 0.765 | 27.72 ± 17.39a | 108.89 ± 99.33b | 0.001 |
5-Flu (n=15) | 24.29 ± 9.11 | 10.82 ± 7.19a | 26.53 ± 23.48a | 0.567 | 83.72± 19.48a | 96.52 ± 27.81a | 0.421 |
Carboplatin (n=22 | 42.52 ± 8.94 | 76.89 ± 60.71a | 80.92 ± 71.62a | 0.329 | 120.80 ± 47.48a | 100.98 ± 38.58a | 0.245 |
Transtuzumab (n=6) | 11.17 ± 7.38 | 27.45 ± 15.57a | 31.19 ± 18.09a | 0.745 | 52.52 ± 16.42a | 34.07 ± 10.65b | 0.042 |
Biomarker | Significant effect across regimens | p-value |
|---|---|---|
AST (U/L) | No | >0.05 |
ALT (U/L) | No | >0.05 |
AST/ALT | No | >0.05 |
Albumin (g/L) | No | >0.05 |
Urea (mg/dL) | No | >0.05 |
eGFR (mL/min/1.73 m²), (Time 3) | Yes (Tetratherapy effects) | 0.006 |
CEA (U/mL) | No | >0.05 |
CA15-3 (U/mL) | No | >0.05 |
Markers | N | Df | P | CI (LB-UB) | ||
|---|---|---|---|---|---|---|
Urea | 120 | -1.53 (-0.0153) | 2.025 | 2 | 0.363 | 0.354 – 0.373 |
eGFR | 120 | -3.77 (-0.0377) | 3.499 | 2 | 0.044 | 0.164 – 0.178 |
AST | 120 | -0.01 (0.0001) | 3.780 | 2 | 0.151 | 0.144 – 0.158 |
ALT | 120 | 0.75 (0.0075) | 0.151 | 2 | 0.927 | 0.925 – 0.935 |
AST/ALT | 120 | 0.16 (0.0016) | 1.832 | 2 | 0.400 | 0.410 – 0.429 |
Albumin | 120 | -1.20 (-0.0120) | 11.24 | 2 | 0.004 | 0.003 – 0.005 |
CEA | 120 | 3.74 (0.0374) | 0.121 | 1 | 0.990 | 0.998 – 1.00 |
CA15-3 | 120 | -12.98 (0.1298) | 7.68 | 1 | 0.006 | 0.006 – 0.010 |
Test Pair (Time 3 – Time 1) | N | Z-score | P Value | Monte Carlo Sig. (2-tailed) | Result Interpretation |
|---|---|---|---|---|---|
AST T3 – T1 | 120 | -0.610 | 0.542 | 0.333 | No Significant Change |
ALT T3 – T1 | 120 | -0.064 | 0.949 | 0.952 | No Significant Change |
eGFR T3 – T1 | 120 | -1.793 | 0.073 | 0.077 | No Significant Change (Trend observed) |
Alb T3 – T 1 | 120 | -1.188 | 0.235 | 0.243 | No Significant Change |
CEA T2 – T1 | 120 | -1.008 | 0.313 | 0.333 | No Significant Change |
CA15-3 T2 - T 1 | 120 | -2.804 | 0.005 | 0.005 | Significant decrease observed |
Factor | Drugs | Ρ | P | ||||
|---|---|---|---|---|---|---|---|
Sex | Monotherapy | 0.186 | 0.042 | ||||
Age | Transtuzummab | 0.218 | 0.017 | ||||
Cyclophosphamide | -0.257 | 0.005 | |||||
Adriblastine | -0.232 | 0.011 | |||||
Bevocipzumab | 0.205 | 0.025 | |||||
Toxol | CRP | 0.233 | 0.015 | ||||
Drug | Biomarker | Time point 1 | Time point 2 | Time point 3 | |||
Ρ | p-value | Ρ | p-value | Ρ | p-value | ||
Cyclophosphamide | UREA | 0.047 | 0.609 | -0.224 | 0.014 | -0.070 | 0.448 |
Cisplatin | eGFR | -0.197 | 0.032 | 0.113 | 0.219 | 0.056 | 0.547 |
AST | -0.221 | 0.016 | -0.025 | 0.790 | -0.091 | 0.326 | |
ALT | -0.039 | 0.671 | -0.208 | 0.023 | -0.098 | 0.293 | |
Capecatabine | UREA | -0.212 | 0.021 | -0.048 | 0.606 | -0.133 | 0.149 |
eGFR | 0.062 | 0.500 | -0.058 | 0.528 | 0.182 | 0.048 | |
AST/ALT | 0.030 | 0.747 | 0.220 | 0.016 | 0.091 | 0.328 | |
ALT | -0.039 | 0.671 | -0.208 | 0.023 | -0.098 | 0.293 | |
Toxol | Albumin | -0.245 | 0.007 | -0.115 | 0.217 | -0.031 | 0.736 |
Paclitaxel | UREA | -0.036 | 0.700 | -0.147 | 0.108 | -0.188 | 0.040 |
AST/ALT | 0.096 | 0.297 | 0.227 | 0.013 | 0.006 | 0.952 | |
ALT | -0.168 | 0.067 | -0.181 | 0.049 | 0.058 | 0.532 | |
4AC60 | AST/ALT | 0.033 | 0.725 | 0.261 | 0.004 | 0.131 | 0.159 |
ALT | -0.002 | 0.982 | -0.204 | 0.002 | -0.041 | 0.657 | |
Transtuzumab | eGFR | 0.198 | 0.031 | 0.158 | 0.086 | 0.233 | 0.011 |
AST/ALT | 0.012 | 0.894 | 0.202 | 0.028 | 0.048 | 0.609 | |
Monotherapy | ALT | -0030 | 0.743 | -0.132 | 0.154 | -0.229 | 0.013 |
Age | CEA | 0.592 | 0.005 | - | - | 0.645 | 0.002 |
Tetratherapy | AST/ALT | -0.031 | 0.769 | 0.069 | 0.455 | 0.236 | 0.010 |
AST | Aspartate Transaminase |
ALT | Alanine Transaminase |
eGFR | Estimated Glomerular Filtration |
CRP | C-reactive Proteins |
CEA | Carcinoembryonic Antigen |
CA15-3 | Cancer Antigen15-3 |
CKD-EPI | Chronic Kidney Disease Epidemiology Collaboration |
SD | Standard Deviation |
Alb | Albumin |
Scr | Serum Creatinine |
BCG | Bromocresol Green |
RDT | Rapid Diagnostic Test |
Variables | Categories | Frequency (n) | Percentage (%) |
|---|---|---|---|
Gender | Male | 27 | 22.5 |
Female | 93 | 77.5 | |
Total | 120 | 100.0 | |
Age group (years) | 20 – 29 | 4 | 3.3 |
30 – 39 | 7 | 5.8 | |
40 – 49 | 20 | 16.7 | |
50 – 59 | 26 | 21.7 | |
60 – 69 | 34 | 28.3 | |
> =70 | 29 | 24.2 | |
Total | 120 | 100.0 | |
Marital status | Single | 32 | 26.7 |
Married | 61 | 50.8 | |
Divorce | 5 | 4.2 | |
Widow/Widower | 22 | 18.3 | |
Total | 120 | 100.0 | |
Educational level | None | 5 | 4.2 |
Primary | 33 | 27.5 | |
Secondary | 47 | 39.2 | |
Tertiary | 35 | 29.2 | |
Total | 120 | 100.0 | |
Region of origin | West | 20 | 16.7 |
Southwest | 24 | 20.0 | |
Littoral | 56 | 46.7 | |
South | 2 | 1.7 | |
Northwest | 10 | 8.3 | |
Centre | 8 | 6.7 | |
Total | 120 | 100.0 | |
Religion | Christian | 116 | 96.7 |
Muslim | 2 | 1.7 | |
Others | 2 | 1.7 | |
Total | 120 | 100.0 | |
Cancer Stage | Stage I | 2 | 1.6 |
Stage II | 20 | 16.7 | |
Stage III | 30 | 25.0 | |
Stage IV | 41 | 34.2 | |
Total | 120 | 100 | |
Chemotherapy agents | Cisplastin | 24 | 20.0 |
Carboplatin | 22 | 18.3 | |
Cyclophosphamide | 21 | 17.5 | |
5 Flu | 15 | 12.5 | |
Adablastin | 13 | 10.8 | |
CDDP | 7 | 5.8 | |
Transtuzumab | 6 | 5.0 | |
Paclitaxel | 5 | 4.2 | |
Bevocizumab | 4 | 3.3 | |
Capecatabine | 4 | 3.3 | |
O4AXC | 4 | 3.3 | |
Naxotere-Herceptin | 2 | 1.7 | |
Tamoxifen | 1 | 0.8 | |
Nevalbin | 1 | 0.8 | |
Total | 120 | 100 | |
Form of therapy | Monotherapy | 32 | 26.7 |
Bi-Therapy | 59 | 47.2 | |
Tri-therapy | 19 | 15.8 | |
Tetra-therapy | 10 | 8.3 | |
Total | 120 | 100.0 |
Biomarker | Time Point of collection | 19–29 (n=7) | 30–39 (n=20) | 40–49 (n=26) |
|---|---|---|---|---|
AST (U/L) | T1 | 24.33±7.24 | 29.27±20.20 | 31.11±14.38 |
T2 | 17.44±4.95 | 28.69±10.54 | 22.20±9.53 | |
T3 | 23.94±6.92 | 26.55±9.23 | 30.00±9.47 | |
ALT (U/L) | T1 | 21.73±6.67 | 19.19±11.61 | 22.31±14.73 |
T2 | 19.53±8.81 | 24.50±12.37 | 20.72±11.45 | |
T3 | 22.67±14.28 | 19.09±11.56 | 19.80±11.52 | |
AST/ALT ratio | T1 | 1.26±0.74 | 1.69±0.85 | 1.64±0.79 |
T2 | 1.06±0.61 | 1.39±0.71 | 1.87±0.88 | |
T3 | 1.49±0.98 | 1.82±1.14 | 1.86±0.92 | |
Albumin (g/L) | T1 | 31.31±13.51 | 31.10±7.60 | 30.95±4.68 |
T2 | 27.07±8.42 | 30.40±6.93 | 26.24±4.34 | |
T3 | 26.08±10.12 | 31.69±10.59 | 31.72±14.53 | |
Urea (mg/dL) | T1 | 38.87±9.03 | 36.16±10.83 | 33.64±10.15 |
T2 | 30.44±9.21 | 34.23±11.43 | 32.45±8.73 | |
T3 | 28.29±16.60 | 33.11±9.51 | 31.35±8.04 | |
eGFR (mL/min/1.73 m²) | T1 | 128.17±5.37 | 127.04±10.01 | 127.65±15.76 |
T2 | 131.72±6.36 | 118.85±18.22 | 120.25±21.81 | |
T3 | 112.29±16.40 | 120.58±12.01 | 124.15±16.33 | |
CRP (mg/L) | – | 25.80±40.31 | 32.22±37.84 | 22.00±27.57 |
CEA (ng/mL) | T1 | 0.00±0.00 | 2.32±0.00 | 41.42±110.94 |
T2 | – | 1.33±0.68 | 48.08±128.88 | |
CA15-3 (U/mL) | T1 | 74.99±51.60 | 103.04±125.35 | 45.48±56.84 |
T2 | 64.24±84.23 | 94.51±116.07 | 55.67±118.70 |
Biomarker | 50–59 (n=24) | 60–69 (n=26) | 70–79 (n=15) | 80–89 (n=2) | Total (n=120) |
|---|---|---|---|---|---|
AST (U/L) | 24.54±8.34 | 25.16±7.33 | 24.03±11.58 | 10.80±0.99 | 26.54±12.78 |
25.03±10.80 | 20.70±9.20 | 33.21±17.73 | 22.90±3.96 | 24.65±11.65 | |
22.93±11.80 | 25.59±12.85 | 30.12±9.43 | 22.85±8.56 | 26.57±10.74 | |
ALT (U/L) | 20.01±10.12 | 20.97±11.10 | 19.96±12.12 | 7.55±3.04 | 20.45±11.65 |
22.26±12.72 | 21.92±13.79 | 23.04±13.63 | 10.60±2.97 | 21.98±12.38 | |
24.14±13.15 | 17.40±9.03 | 26.64±12.45 | 30.65±7.14 | 21.20±11.82 | |
AST/ALT ratio | 1.54±1.15 | 1.77±1.74 | 0.20±3.83 | 1.53±0.48 | 1.45±1.78 |
1.40±1.07 | 1.25±0.78 | 1.77±0.90 | 2.19±0.24 | 1.29±1.17 | |
1.15±0.77 | 1.93±1.38 | 1.23±0.44 | 0.73±0.11 | 1.61±1.05 | |
Albumin (g/L) | 33.05±7.44 | 33.55±10.86 | 28.04±7.57 | 32.95±13.22 | 31.66±8.37 |
29.97±9.11 | 29.29±9.97 | 25.59±8.91 | 27.60±17.25 | 28.36±8.24 | |
30.37±10.69 | 30.86±9.87 | 27.80±8.87 | 39.40±3.96 | 30.59±11.07 | |
Urea (mg/dL) | 33.18±11.44 | 35.95±10.84 | 26.79±10.59 | 35.25±11.10 | 33.95±10.88 |
30.31±10.74 | 36.40±10.53 | 37.13±12.77 | 41.45±3.46 | 33.79±10.65 | |
33.30±10.10 | 31.61±12.53 | 34.43±10.92 | 38.75±2.76 | 32.42±10.56 | |
eGFR (mL/min/1.73 m²) | 125.12±14.70 | 115.35±29.88 | 134.71±17.58 | 140.98±17.01 | 125.50±19.44 |
120.89±28.31 | 118.60±26.58 | 126.27±11.88 | 138.56±20.44 | 121.52±22.27 | |
122.53±17.69 | 119.56±18.44 | 132.54±36.02 | 125.99±5.70 | 122.61±20.02 | |
CRP (mg/L) CEA (ng/mL) | 17.57±27.21 | 18.00±27.29 | 15.40±25.36 | 49.50±65.76 | 30.20±21.64 |
32.14±56.54 | 15.00±21.52 | 12.16±8.27 | 0.00±0.00 | 27.45±10.23 | |
38.09±67.73 | 9.48±8.67 | 29.88±28.45 | 0.00±0.00 | 31.19±8.89 | |
CA15-3 (U/mL) | 110.88±109.39 | 62.76±36.77 | 172.21±187.03 | 10.00±0.00 | 91.21±15.03 |
92.99±72.12 | 39.22±22.60 | 121.32±156.38 | 5.02±0.00 | 78.24±10.71 |
Biomarker | Time | Monotherapy (n=32) | Bitherapy (n=59) | Tritherapy (n=19) | Tetratherapy (n=10) | Total (120) | p value |
|---|---|---|---|---|---|---|---|
AST (U/L) | T1 | 25.87±13.13 | 25.59±8.92 | 25.93±8.21 | 16.25±8.21 | 25.30±10.17 | 0.347 |
T2 | 24.49±10.35 | 24.04±10.06 | 27.81±12.51 | 33.75±21.94 | 25.09±11.13 | 0.413 | |
T3 | 25.32±10.79 | 26.88±10.11 | 28.06±10.39 | 32.60±22.73 | 26.86±10.92 | 0.161 | |
ALT (U/L) | T1 | 20.16±12.10 | 19.02±11.62 | 20.12±10.88 | 13.78±4.77 | 19.24±11.38 | 0.764 |
T2 | 18.66±11.78 | 22.39±12.24 | 23.24±12.08 | 15.20±13.71 | 21.18±12.14 | 0.413 | |
T3 | 17.16±11.82 | 21.04±11.47 | 26.02±13.18 | 16.70±5.82 | 20.44±11.80 | 0.161 | |
AST/ALT ratio | T1 | 1.44±0.55 | 1.46±2.56 | 1.49±0.55 | 1.44±1.18 | 1.46±1.94 | 0.999 |
T2 | 1.24±2.06 | 1.27±0.72 | 1.53±1.01 | 2.57±0.79 | 1.35±1.27 | 0.235 | |
T3 | 1.95±1.17 | 1.65±1.08 | 1.21±0.47 | 2.11±1.66 | 1.69±1.09 | 0.211 | |
Albumin (g/L) | T1 | 31.06±6.61 | 31.29±7.34 | 32.48±7.19 | 26.50±8.89 | 31.18±7.15 | 0.554 |
T2 | 27.80±6.77 | 28.07±8.05 | 29.98±10.60 | 27.93±8.63 | 28.24±8.01 | 0.885 | |
T3 | 32.76±15.29 | 30.59±9.71 | 29.23±9.93 | 34.85±13.86 | 31.19±11.56 | 0.725 | |
Urea (mg/dL) | T1 | 33.39±12.03 | 33.85±9.39 | 31.53±11.58 | 31.28±20.31 | 33.32±10.81 | 0.900 |
T2 | 35.80±10.99 | 32.86±10.19 | 31.15±11.32 | 32.73±19.38 | 33.42±10.91 | 0.609 | |
T3 | 33.10±10.29 | 31.29±10.31 | 31.93±12.36 | 36.40±16.94 | 32.08±10.75 | 0.770 | |
eGFR (mL/min/1.73 m²) | T1 | 128.43±13.97 | 125.45±16.27 | 124.24±20.13 | 133.03±3.47 | 126.43±15.83 | 0.685 |
T2 | 125.27±12.55 | 116.36±29.95 | 126.45±18.88 | 130.26±4.35 | 120.70±24.55 | 0.297 | |
T3 | 126.39±17.01 | 120.08±17.17 | 117.08±16.36 | 154.51±56.69 | 122.90±20.80 | 0.006 | |
CEA (ng/mL) | T1 | 3.45±2.17 | 50.09±109.11 | 10.82±10.16 | – | 27.69±78.14 | 0.547 |
T2 | 3.92±3.29 | 53.07±127.09 | 26.53±33.20 | – | 31.32±90.39 | 0.633 | |
CA15-3 (U/mL) | T1 | 52.16±41.88 | 85.34±105.60 | 79.94±91.65 | 102.22±83.61 | 77.62±88.51 | 0.761 |
T2 | 59.09±60.05 | 72.36±122.16 | 67.09±65.74 | 73.44±61.60 | 68.27±95.00 | 0.987 |
| [1] | Sung H, Ferlay J, Siegel RL, Laversanne M, soerjomataram I, jemal A, et al. Global cancer statistics 2020: GLOBOCAN estimates of incidence and mortality worldwide-for 36 cancers in 185 countries. CA Cancer J Clin. 2021, 71(3), 209-49. |
| [2] | Allemani C, Matsuda T, DiCarlo V, Harewood R, Matz M, Nikšić M, et al. Global surveillance of trends in cancer survival 2000-14(CONCORD-3): Analysis of individual records for 37 513 025 patients diagnosed with one of 18 cancers from 322 population-based registries in 71 countries. Lancet 2018, 391(10125), 1023-75. |
| [3] | Holohan C, Van Schaeybroeck S, Longley DB, Johnston PG. Cancer drug resistance: An evolving paradigm. Nat Rev Cancer. 2013, 13(10), 714-26. |
| [4] | Longley DB, Johnston PG. Molecular mechanisms of drug resistance. J Pathol. 2025, 205(2), 275-92. |
| [5] | Gottesman MM, Lavi O, Hall MD, Gillet JP. Toward a better understanding of the complexicity of cancer drug resistance. Annu Rev PharmacolToxicol. 2016, 56, 85-102. |
| [6] | Nicolini A, Tartarelli G, Carpi A, Metelli MR, Ferrari P, Anselmi L, et al. Intensive post-operative follow-up of breast cancer patients with tumour markers: CEA, TPA or CA15.3 vs MCA and MCA-CA15.3 vs CEA-TPA-CA15.3 panel in the early detection of distant metastases. BMC Cancer. 2006, 6, 269. |
| [7] | Duffy MJ. Tumor markers in clinical practice: A review focusing on common solid cancers. Med Princ Pract. 2013, 22(1), 4-11. |
| [8] | Seale KN, Tkaczuk KHR. Circulating biomarkers in breast cancer Clin Breast Cancer. 2022, 22(3), e319-e331. |
| [9] | Amjad MT, Chidharla A, Kasi A. Cancer Chemotherapy, [Updated 2023 Feb 27]. In: Stat Pearls [Internet]. Treasure Island (FL): Stat Pearls Publishing. 2025. |
| [10] | McDonald GB, Hinds MS, Fisher LD, Schoch HG, Wolford JL, Banaji M, Hardin BJ, Shulman HM, Clift RA. Veno-occlusive disease of the liver and multiorgan failure after bone marrow transplantation: a cohort study of 355 patients. Ann Intern Med. 1993, 118(4), 255-67. |
| [11] | Lopez J, Carl A, Burtis, Edward R, Ashwood and David E. Bruns(eds): Tietz textbook of Clinical Chemistry and Molecular Diagnosis (5th edition): Elsevier, st. Louis, USA, 2012, 2238pp. Indian J Clin Biochem. 2013, 28(1), 104-5. |
| [12] | Conklin KA. Chemotherapy-associated oxidative stress: impact on chemotherapeutic effectiveness. Integrative Cancer Therapies. 2004, 3(4), 294-300. |
| [13] | Pabla N, Dong Z. Cisplatin nephrotoxicity: mechanism and reno-protective strategies. Kidney Int. 2008, 73(9), 994-1007. |
| [14] | Pepys MB, Hirschfield GM. C-reactive protein: A critical update. J Clin Invest. 2003, 111(12), 1805-12. |
| [15] | Roxburgh CSG, Mc Millan DC. Cancer and systemic inflammation: Treat the tumour and treat the host. Br J Cancer. 2014, 110(6), 1409-12. |
| [16] | Joko-Fru WY, Miranda-Filho A, Soerjomataram I, Egue M, Akele-Akpo MT, N`da G, et al. Breast cancer survival in sub-Saharan Africa by age, stage at diagnosis and human development index: A population-based registry study. Int J Cancer. 2020, 146(5), 1208-1218. |
| [17] | Ferlay J, Ervik M, Lam F, Colombet M, Mery L, Piñeros M, et al., Global cancer observatory: Cancer Today. Lyon: International Agency for Research on Cancer: 2021. |
| [18] | Kabel AM. Tumor markers of breast cancer: New prospective. J Oncol Sci. 2017, 3, 5e11. |
| [19] | Daneil WW. Biostatistics: A foundation for analysis in the health sciences. 7th ed. New York: John Wiley & Sons, 1999. |
| [20] | Toora BD, Rajagopal G. Measurement of creatinine by Jaffe`s reaction, determination of concentration of sodium hydroxide required for maximum color development. Indian J Exp Biol. 2002, 40(3), 352-354. |
| [21] | Inker LA, Eneanya ND, Coresh J, Tighiouart H, Wang D, Sang Y, et al. New creatinine and cystatin C-based equations to estimate GFR. N Engl J Med. 2021, 385(19), 1737-49. |
| [22] | Talke H, Schubert A. Urease determination in blood serum with the new blood urea determination technic. Klin Wochenschr. 1965, 43, 174-5. |
| [23] | Bergmeyer HU, Hørder M, Rej R. Approved recommendations IFCC methods for the measurement of catalytic concentration of enzymes. J Clin Chem Clin Biochem. 1986, 24(7), 481-95. |
| [24] | Doumas BT, Watson WA, Biggs HG. Albumin standards and the measurement of serum albumin with bromocresol green. Clin Chim Acta. 1971, 31(1), 87-96. |
| [25] | Sharma R, Aashima, Nanda M, Fronterre C, Sewagudde P, Ssentongo AE, et al. Mapping Cancer in Africa: A comprehensive and comparable characterization of 34 cancer types using estimates from GLOBOCAN 2020. Front Public Health. 2022, 10, 839835. |
| [26] | Crombag MR, Joerger M, Thülimann B, Schellens JH, Beijnen JH, Huitema AD. Pharmacokinetics of selected anti-cancer drugs in elderly cancer patients: Focus on breast cancer. Cancer (Basel). 2016, 8(1), 6. |
| [27] | Lyrio RMDC, Rocha BRA, Corrêa ALRM, Mascarenhas MGS, Santos FL, Maia RDH, et al. Chemotherapy-induced acute kidney injury: epidemiology, pathophysiology, and therapeutic approaches. Front Nephrol. 2024, 4, 1436896. |
| [28] | Ströhr W, Paulides M, Bielack S, Jürgens H, Koscielniak E, Rossi R, et al. Nephrotoxicity of cisplatin and carboplatin in sarcoma patients: a report from the late effective surveillance system. Pediatr Blood Cancer. 2007, 48(2), 140-7. |
| [29] | Arany I, Safirstein RL. Cisplatin nephrotoxicity. Semin Nephrol. 2003, 23(5), 460-4. |
| [30] | Launay-Vacher V, Rey JB, Insard-Bagnis C, Deray G, Daouphars M. Prevention of cisplatin nephrotoxicity: State of the heart and recommendations from the European Society of clinical Pharmacy special interest group on cancer care. Cancer ChemotherPharmacol. 2008, 61(6), 903-909. |
| [31] | Chen C, Xie D, Gewirtz DA, Li N. Nephrotoxicity in cancer treatment: An update. Adv Cancer Res. 2022, 155, 77-129. |
| [32] | Thatishetty AV, Agresti N, O`Brien CB. Chemotherapy-induced hepatotoxicity. Clin Liver Dis. 2013, 17(4), 671-86. |
| [33] | Tang Q, Li X, Sun CR. Predictive evaluation of serum albumin levels on cancer survival: a prospetive cohort study. Front Oncol. 2024, 14, 1323192. |
| [34] | Zimmerman HJ. Drug-induced liver disease. Clin Liver Dis. 2000, 4(1), 73-96. |
| [35] | Don BR, Kavsen G. Serum albumin: Relationship to inflammation and nutrition. Semin Dial. 2004, 17(6), 432-7. |
| [36] | Gupta D, Lis CG. Pretreatment serum albumin as a predictor of cancer survival: A systematic review. Nutr J. 2010, 9, 69. |
| [37] | Hall C, Clarke L, Pal A, Buchwald P, Eglinton T, Wakeman C, et al. A review of the role of carcinoembryonic antigen in clinical practice. Ann Coloproctol. 2019, 35(6), 94-305. |
| [38] | AlDoughaim M, AlSuhebany N, AlZahrani M, AlQahtani T, Al Ghamdi S, et al. Cancer biomarkers and precision oncology: A review of recent trends and innovations. Clin Med Insights Oncol. 2024, 18, 11795549241298541. |
| [39] | Duffy MJ, Evoy D, McDermott EW. CA15-3: Uses and limitation as a biomarker for breast cancer. Clin Chim Acta. 2010, 411(23-24), 1869-74. |
APA Style
Siri, P., Muankang, J. T. K., Wilfred, A. A., Ekia-Abeiya, M., Kamguia, G. L. Y., et al. (2026). Cancer Antigen 15-3 and Carcinoembryonic Antigen Chemotherapeutic Response and Associated Hepato-Renal Toxicity in Cameroonian Cancer Patients. Journal of Cancer Treatment and Research, 14(1), 9-27. https://doi.org/10.11648/j.jctr.20261401.12
ACS Style
Siri, P.; Muankang, J. T. K.; Wilfred, A. A.; Ekia-Abeiya, M.; Kamguia, G. L. Y., et al. Cancer Antigen 15-3 and Carcinoembryonic Antigen Chemotherapeutic Response and Associated Hepato-Renal Toxicity in Cameroonian Cancer Patients. J. Cancer Treat. Res. 2026, 14(1), 9-27. doi: 10.11648/j.jctr.20261401.12
AMA Style
Siri P, Muankang JTK, Wilfred AA, Ekia-Abeiya M, Kamguia GLY, et al. Cancer Antigen 15-3 and Carcinoembryonic Antigen Chemotherapeutic Response and Associated Hepato-Renal Toxicity in Cameroonian Cancer Patients. J Cancer Treat Res. 2026;14(1):9-27. doi: 10.11648/j.jctr.20261401.12
@article{10.11648/j.jctr.20261401.12,
  author = {Pamela Siri and Junior Tegha Kum Muankang and Angie Abia Wilfred and Modest Ekia-Abeiya and Gabriela Leslie Yemdjo Kamguia and Faustin Pascal Manfo Tsague and Edouard Nantia Akono},
  title = {Cancer Antigen 15-3 and Carcinoembryonic Antigen Chemotherapeutic Response and Associated Hepato-Renal Toxicity in Cameroonian Cancer Patients},
  journal = {Journal of Cancer Treatment and Research},
  volume = {14},
  number = {1},
  pages = {9-27},
  doi = {10.11648/j.jctr.20261401.12},
  url = {https://doi.org/10.11648/j.jctr.20261401.12},
  eprint = {https://article.sciencepublishinggroup.com/pdf/10.11648.j.jctr.20261401.12},
  abstract = {Background: Chemotherapy remains central to cancer management in sub-Saharan Africa but is frequently complicated by treatment resistance and cumulative hepato-renal toxicity. Longitudinal biomarker monitoring may improve early detection of subclinical organ dysfunction and therapeutic response. This study evaluated longitudinal changes in hepatic, renal, inflammatory, and tumor-associated biomarkers to elucidate chemotherapy response and resistance patterns among cancer patients receiving systemic therapy in Cameroon. Materials and Methods: A longitudinal observational study was conducted among 120 cancer patients treated at the Cameroon Oncology Centre (February-July 2025). Serum liver enzymes (aspartate aminotransferase (AST), alanine aminotransferase (ALT)), albumin, urea, creatinine-derived estimated glomerular filtration rate (eGFR), C-reactive protein (CRP) measurement was done once at the end of the chemotherapeutic period were measured at baseline and over three follow-up time points at two-month intervals, while cancer biomarkers, namely carcinoembryonic antigen (CEA), and cancer antigen 15-3 (CA15-3) were screened within two interval periods. Non-parametric analyses (Kruskal–Wallis, Friedman tests) assessed group differences and monotonic trends, while Spearman’s correlation evaluated treatment–biomarker associations. Results: Participants were predominantly female (77.5%), with advanced-stage disease (Stage III–IV: 59.2%). Liver enzymes remained largely stable throughout follow-up, indicating preserved hepatocellular integrity. In contrast, albumin exhibited a significant monotonic decline (−1.20%, p = 0.004), reflecting cumulative metabolic and inflammatory stress. Renal function showed a modest but significant decline in eGFR (−3.77%, p = 0.044), particularly among platinum-based regimens, despite stable urea levels. Tumour marker analysis revealed a pronounced and consistent reduction in CA15-3 (−12.98%, p = 0.006), whereas CEA showed no significant longitudinal trend. Drug-specific correlations supported time-dependent renal and hepatic effects, particularly with cisplatin and combination therapies. Conclusion: Longitudinal biomarker profiling reveals subclinical renal stress, systemic metabolic burden, and differential tumour marker responsiveness during chemotherapy. CA15-3 and eGFR emerged as sensitive indicators of treatment response and toxicity, underscoring the value of integrated biomarker monitoring in resource-limited oncology settings.},
 year = {2026}
}
TY  - JOUR
T1  - Cancer Antigen 15-3 and Carcinoembryonic Antigen Chemotherapeutic Response and Associated Hepato-Renal Toxicity in Cameroonian Cancer Patients
AU  - Pamela Siri
AU  - Junior Tegha Kum Muankang
AU  - Angie Abia Wilfred
AU  - Modest Ekia-Abeiya
AU  - Gabriela Leslie Yemdjo Kamguia
AU  - Faustin Pascal Manfo Tsague
AU  - Edouard Nantia Akono
Y1  - 2026/02/26
PY  - 2026
N1  - https://doi.org/10.11648/j.jctr.20261401.12
DO  - 10.11648/j.jctr.20261401.12
T2  - Journal of Cancer Treatment and Research
JF  - Journal of Cancer Treatment and Research
JO  - Journal of Cancer Treatment and Research
SP  - 9
EP  - 27
PB  - Science Publishing Group
SN  - 2376-7790
UR  - https://doi.org/10.11648/j.jctr.20261401.12
AB  - Background: Chemotherapy remains central to cancer management in sub-Saharan Africa but is frequently complicated by treatment resistance and cumulative hepato-renal toxicity. Longitudinal biomarker monitoring may improve early detection of subclinical organ dysfunction and therapeutic response. This study evaluated longitudinal changes in hepatic, renal, inflammatory, and tumor-associated biomarkers to elucidate chemotherapy response and resistance patterns among cancer patients receiving systemic therapy in Cameroon. Materials and Methods: A longitudinal observational study was conducted among 120 cancer patients treated at the Cameroon Oncology Centre (February-July 2025). Serum liver enzymes (aspartate aminotransferase (AST), alanine aminotransferase (ALT)), albumin, urea, creatinine-derived estimated glomerular filtration rate (eGFR), C-reactive protein (CRP) measurement was done once at the end of the chemotherapeutic period were measured at baseline and over three follow-up time points at two-month intervals, while cancer biomarkers, namely carcinoembryonic antigen (CEA), and cancer antigen 15-3 (CA15-3) were screened within two interval periods. Non-parametric analyses (Kruskal–Wallis, Friedman tests) assessed group differences and monotonic trends, while Spearman’s correlation evaluated treatment–biomarker associations. Results: Participants were predominantly female (77.5%), with advanced-stage disease (Stage III–IV: 59.2%). Liver enzymes remained largely stable throughout follow-up, indicating preserved hepatocellular integrity. In contrast, albumin exhibited a significant monotonic decline (−1.20%, p = 0.004), reflecting cumulative metabolic and inflammatory stress. Renal function showed a modest but significant decline in eGFR (−3.77%, p = 0.044), particularly among platinum-based regimens, despite stable urea levels. Tumour marker analysis revealed a pronounced and consistent reduction in CA15-3 (−12.98%, p = 0.006), whereas CEA showed no significant longitudinal trend. Drug-specific correlations supported time-dependent renal and hepatic effects, particularly with cisplatin and combination therapies. Conclusion: Longitudinal biomarker profiling reveals subclinical renal stress, systemic metabolic burden, and differential tumour marker responsiveness during chemotherapy. CA15-3 and eGFR emerged as sensitive indicators of treatment response and toxicity, underscoring the value of integrated biomarker monitoring in resource-limited oncology settings.
VL  - 14
IS  - 1
ER  -
Department of Biochemistry, University of Bamenda, Bambili, Cameroon
Department of Biochemistry, University of Bamenda, Bambili, Cameroon
Department of Biochemistry, University of Yaounde, Yaounde, Cameroon
Department of Biochemistry, University of Bamenda, Bambili, Cameroon
Department of Biochemistry, University of Bamenda, Bambili, Cameroon
Department of Biochemistry and Molecular Biology, University of Buea, Buea, Cameroon
Department of Biochemistry, University of Bamenda, Bambili, Cameroon
Information