Hepatocellular carcinoma (HCC) is the third leading cause of cancer-related death, and anti-silencing function 1B histone chaperone (ASF1B) has been implicated in several cancers. This study aimed to investigate the role and molecular mechanism of ASF1B in HCC. ASF1B expression was analyzed using the TIMER2, GEO, Oncomine, and GEPIA2 databases, as well as western blotting. Cell viability, cell cycle distribution, and apoptosis were assessed via CCK-8 assay and flow cytometry, respectively. Survival analysis and immune infiltration analysis were performed using the TIMER2 database, and enrichment analysis was conducted via Metascape. Results showed that ASF1B expression was significantly higher in HCC tissues than in normal tissues, and high ASF1B expression predicted poor prognosis and was associated with higher tumor stage. Knockdown of ASF1B by siRNA significantly reduced cell viability, promoted apoptosis, and induced G1 phase cell cycle arrest in SNU-423 cells. Moreover, ASF1B expression was positively correlated with the infiltration levels of immune cells and tumor microenvironment signature cells, particularly functional T cells. Enrichment analysis further indicated that ASF1B may contribute to HCC progression through mechanisms involving cell cycle, cell division and differentiation, and DNA replication and repair. Collectively, these findings suggest that ASF1B overexpression predicts poor prognosis and increased immune infiltration in HCC, highlighting ASF1B as a potential therapeutic target for this malignancy.
| Published in | Cancer Research Journal (Volume 14, Issue 2) |
| DOI | 10.11648/j.crj.20261402.13 |
| Page(s) | 42-58 |
| Creative Commons |
This is an Open Access article, distributed under the terms of the Creative Commons Attribution 4.0 International License (http://creativecommons.org/licenses/by/4.0/), which permits unrestricted use, distribution and reproduction in any medium or format, provided the original work is properly cited. |
| Copyright |
Copyright © The Author(s), 2026. Published by Science Publishing Group |
ASF1B, Prognosis, Immune Infiltration, Cell Cycle Arrest, Apoptosis, Hepatocellular Carcinoma
GSE Series | Tumor | Nontumor | Platform |
|---|---|---|---|
GSE14520 | 225 | 220 | GPL3921 [HT_HG-U133A] Affymetrix HT Human Genome U133A Array |
GSE19665 | 10 | 10 | GPL570 [HG-U133_Plus_2] Affymetrix Human Genome U133 Plus 2.0 Array |
GSE25097 | 268 | 243 | GPL10687Rosetta/Merck Human RSTA Affymetrix 1.0 microarray, Custom CDF |
GSE45267 | 46 | 41 | GPL570 [HG-U133_Plus_2] Affymetrix Human Genome U133 Plus 2.0 Array |
GSE45436 | 93 | 41 | GPL570 [HG-U133_Plus_2] Affymetrix Human Genome U133 Plus 2.0 Array |
GSE55092 | 49 | 91 | GPL570 [HG-U133_Plus_2] Affymetrix Human Genome U133 Plus 2.0 Array |
GSE60502 | 18 | 18 | GPL96 [HG-U133A] Affymetrix Human Genome U133A Array |
GSE62232 | 81 | 10 | GPL570 [HG-U133_Plus_2] Affymetrix Human Genome U133 Plus 2.0 Array |
GSE65372 | 39 | 15 | GPL14951Illumina HumanHT-12 WG-DASL V4.0 R2 expression beadchip |
GSE76297 | 62 | 59 | GPL17586 [HTA-2_0] Affymetrix Human Transcriptome Array 2.0 [transcript (gene) version] |
GSE76311 | 62 | 59 | GPL17586 [HTA-2_0] Affymetrix Human Transcriptome Array 2.0 [transcript (gene) version] |
GSE77314 | 50 | 50 | GPL9052Illumina Genome Analyzer (Homo sapiens) |
GSE84402 | 14 | 14 | GPL570 [HG-U133_Plus_2] Affymetrix Human Genome U133 Plus 2.0 Array |
GSE84598 | 22 | 22 | GPL10558 Illumina HumanHT-12 V4.0 expression beadchip |
GSE87630 | 64 | 30 | GPL6947 Illumina HumanHT-12 V3.0 expression beadchip |
GSE112790 | 183 | 15 | GPL570 [HG-U133_Plus_2] Affymetrix Human Genome U133 Plus 2.0 Array |
GSE121248 | 70 | 37 | GPL570 [HG-U133_Plus_2] Affymetrix Human Genome U133 Plus 2.0 Array |
Description | Gene markers | None | Purity | ||
|---|---|---|---|---|---|
cor | p | cor | p | ||
CD8+ T cell | CD8A | 0.196609 | 0.000138 | 0.323493 | 7.60E-10 |
CD8B | 0.200959 | 9.72E-05 | 0.320271 | 1.14E-09 | |
T cell (general) | CD3D | 0.251919 | 8.86E-07 | 0.380106 | 2.66E-13 |
CD3E | 0.163741 | 0.001553 | 0.332013 | 2.54E-10 | |
CD2 | 0.182919 | 0.000398 | 0.338656 | 1.05E-10 | |
B cell | CD19 | 0.269462 | 1.36E-07 | 0.361135 | 4.57E-12 |
CD79A | 0.156253 | 0.002544 | 0.289312 | 4.46E-08 | |
BLK | -0.05908 | 0.256349 | 0.031013 | 0.565908 | |
FCRL2 | 0.152728 | 0.003186 | 0.291278 | 3.58E-08 | |
KIAA0125 | 0.133591 | 0.009994 | 0.258491 | 1.13E-06 | |
MS4A1 | 0.071628 | 0.168585 | 0.199453 | 0.000192 | |
PNOC | 0.176043 | 0.000659 | 0.302917 | 9.39E-09 | |
SPIB | 0.360987 | 7.34E-13 | 0.457771 | 2.84E-19 | |
TCL1A | 0.079163 | 0.128002 | 0.16683 | 0.001875 | |
TNFRSF17 | 0.149971 | 0.003788 | 0.293682 | 2.73E-08 | |
Central memory T cell | CCR7 | 0.072699 | 0.16229 | 0.229928 | 1.61E-05 |
IL7R | 0.02216 | 0.67052 | 0.142408 | 0.008073 | |
SELL | 0.153153 | 0.003102 | 0.277343 | 1.64E-07 | |
Resident memory T cell | CD69 | 0.114336 | 0.027661 | 0.252419 | 2.05E-06 |
CXCR6 | 0.150834 | 0.003589 | 0.300655 | 1.22E-08 | |
ITGAE | 0.304042 | 2.25E-09 | 0.31969 | 1.23E-09 | |
MYADM | 0.326247 | 1.2E-10 | 0.365652 | 2.36E-12 | |
Effector Treg T cell | CCR8 | 0.318931 | 3.23E-10 | 0.421629 | 2.66E-16 |
CTLA4 | 0.299126 | 4.17E-09 | 0.420781 | 3.09E-16 | |
FOXP3 | 0.14694 | 0.004566 | 0.232811 | 1.25E-05 | |
TNFRSF9 | 0.307224 | 1.50E-09 | 0.400713 | 9.73E-15 | |
TAM | CCL2 | 0.069595 | 0.181029 | 0.194732 | 0.000274 |
CD68 | 0.204134 | 7.48E-05 | 0.308816 | 4.66E-09 | |
IL10 | 0.175267 | 0.000697 | 0.29718 | 1.83E-08 | |
Effector T cell | CX3CR1 | 0.130788 | 0.011686 | 0.191782 | 0.00034 |
FGFBP2 | -0.13139 | 0.011303 | -0.10276 | 0.056538 | |
FCGR3A | 0.293332 | 8.51E-09 | 0.407226 | 3.26E-15 | |
Monocyte | CD86 | 0.270858 | 1.17E-07 | 0.438134 | 1.29E-17 |
CD115 (CSF1R) | 0.141789 | 0.006225 | 0.300485 | 1.25E-08 | |
M1 Macrophage | INOS (NOS2) | 0.00083 | 0.987291 | 0.012585 | 0.815819 |
IRF5 | 0.403556 | 5.79E-16 | 0.413476 | 1.11E-15 | |
COX2(PTGS2) | 0.05574 | 0.284241 | 0.189491 | 0.000402 | |
M2 Macrophage | CD163 | 0.039251 | 0.450991 | 0.1597 | 0.002933 |
VSIG4 | 0.072892 | 0.161176 | 0.199248 | 0.000195 | |
MS4A4A | 0.057195 | 0.271839 | 0.20044 | 0.000179 | |
Natural killer cell | KIR2DL1 | -0.01205 | 0.817055 | -0.02929 | 0.587747 |
KIR2DL3 | 0.187391 | 0.000284 | 0.238016 | 7.85E-06 | |
KIR2DL4 | 0.230101 | 7.56E-06 | 0.271342 | 3.09E-07 | |
KIR3DL1 | 0.0203 | 0.696743 | 0.039788 | 0.461336 | |
KIR3DL2 | 0.090125 | 0.082989 | 0.14042 | 0.00901 | |
KIR3DL3 | 0.04537 | 0.383546 | 0.053374 | 0.322916 | |
KIR2DS4 | 0.078105 | 0.133191 | 0.0774 | 0.151405 | |
XCL1 | 0.327251 | 1.04E-10 | 0.377611 | 3.90E-13 | |
XCL2 | 0.242794 | 2.23E-06 | 0.328919 | 3.79E-10 | |
NCR1 | 0.03214 | 0.537154 | 0.097916 | 0.069298 | |
Neutrophils | CD66b (CEACAM8) | 0.054238 | 0.297438 | 0.088409 | 0.101137 |
CCR7 | 0.072699 | 0.16229 | 0.229928 | 1.61E-05 | |
CD11b (ITGAM) | 0.289616 | 1.33E-08 | 0.398096 | 1.50E-14 | |
FPR1 | 0.1829 | 0.000399 | 0.330081 | 3.26E-10 | |
SIGLEC5 | 0.226133 | 1.09E-05 | 0.36605 | 2.23E-12 | |
CSF3R | 0.254492 | 6.79E-07 | 0.40275 | 6.93E-15 | |
FCAR | 0.059534 | 0.252687 | 0.166233 | 0.001948 | |
FCGR3B | 0.164692 | 0.001456 | 0.204082 | 0.000135 | |
CEACAM3 | 0.113215 | 0.029232 | 0.205666 | 0.000119 | |
S100A12 | -0.06339 | 0.223182 | -0.02338 | 0.665162 | |
Tfh | BCL6 | 0.126637 | 0.014654 | 0.134679 | 0.012283 |
IL21 | 0.140968 | 0.006535 | 0.185375 | 0.000539 | |
Treg | CCR8 | 0.318931 | 3.23E-10 | 0.421629 | 2.66E-16 |
FOXP3 | 0.14694 | 0.004566 | 0.232811 | 1.25E-05 | |
STAT5B | 0.224771 | 1.24E-05 | 0.210581 | 8.10E-05 | |
TGFβ (TGFB1) | 0.242877 | 2.21E-06 | 0.348022 | 2.94E-11 | |
STAT3 | 0.130141 | 0.01211 | 0.182949 | 0.000639 | |
T cell exhaustion | PD-1 (PDCD1) | 0.314751 | 5.63E-10 | 0.427609 | 9.06E-17 |
CTLA4 | 0.299126 | 4.17E-09 | 0.420781 | 3.09E-16 | |
GZMB | 0.095853 | 0.065142 | 0.181839 | 0.00069 | |
TIM-3 (HAVCR2) | 0.287047 | 1.81E-08 | 0.461707 | 1.28E-19 | |
LAG3 | 0.334483 | 3.78E-11 | 0.388298 | 7.33E-14 | |
PDL1(CD274) | 0.228457 | 8.81E-06 | 0.315012 | 2.19E-09 | |
TIGIT | 0.266017 | 1.99E-07 | 0.405534 | 4.34E-15 | |
TPSB2 | -0.05715 | 0.272195 | -0.00466 | 0.93131 | |
Mast cell | TPSAB1 | -0.07116 | 0.171391 | -0.0019 | 0.971885 |
CPA3 | -0.02792 | 0.591908 | 0.055804 | 0.301339 | |
MS4A2 | -0.00373 | 0.942891 | 0.066717 | 0.216427 | |
HDC | -0.16602 | 0.00133 | -0.11699 | 0.029817 | |
Th1 | T-bet (TBX21) | 0.051447 | 0.32303 | 0.169197 | 0.00161 |
STAT4 | 0.241966 | 2.42E-06 | 0.314211 | 2.42E-09 | |
STAT1 | 0.334533 | 3.76E-11 | 0.387227 | 8.70E-14 | |
IFN-γ (IFNG) | 0.284543 | 2.43E-08 | 0.382455 | 1.84E-13 | |
TNF-α (TNF) | 0.23286 | 5.83E-06 | 0.370821 | 1.09E-12 | |
Th2 | GATA3 | 0.169848 | 0.001022 | 0.317823 | 1.55E-09 |
STAT6 | 0.127046 | 0.014336 | 0.122759 | 0.022578 | |
STAT5A | 0.312305 | 7.77E-10 | 0.382435 | 1.85E-13 | |
IL13 | 0.108926 | 0.035974 | 0.122335 | 0.023053 | |
Dendritic cell | CCL13 | 0.146127 | 0.004799 | 0.219558 | 3.90E-05 |
BDCA-1(CD1C) | 0.082349 | 0.11331 | 0.184082 | 0.00059 | |
CD209 | 0.092936 | 0.073793 | 0.181303 | 0.000716 | |
HLA-DPA1 | 0.140941 | 0.006545 | 0.285453 | 6.83E-08 | |
HLA-DPB1 | 0.175135 | 0.000704 | 0.316544 | 1.82E-09 | |
HLA-DQB1 | 0.147584 | 0.00439 | 0.272155 | 2.84E-07 | |
HLA-DRA | 0.172089 | 0.000874 | 0.310943 | 3.60E-09 | |
CD11c (ITGAX) | 0.283199 | 2.85E-08 | 0.425308 | 1.37E-16 | |
BDCA-4(NRP1) | 0.193353 | 0.000179 | 0.224526 | 2.56E-05 | |
HSD11B1 | -0.32727 | 1.04E-10 | -0.31921 | 1.30E-09 | |
HCC | Hepatocellular Carcinoma |
ASF1B | Anti-silencing Function 1B Histone Chaperone |
PD‐1 | Programmed cell Death 1 |
TMB | Tumor Mutational Burden |
PD-L1 | Programmed cell Death 1 Ligand 1 |
GEO | Gene Expression Omnibus |
MDSC | Myeloid Derived Suppressor Cells |
| [1] | European Association for the Study of the L, European Organisation for R, Treatment of C. EASL-EORTC clinical practice guidelines: management of hepatocellular carcinoma. J Hepatol. 2012, 56(4): 908-43. |
| [2] | Han Y, Liu D, Li L. PD-1/PD-L1 pathway: current researches in cancer. American Journal of Cancer Research. 2020, 10(3): 727-42. |
| [3] | Zongyi Y, Xiaowu L. Immunotherapy for hepatocellular carcinoma. Cancer Letters. 2020, 4708-17. |
| [4] | Gibney GT, Weiner LM, Atkins MB. Predictive biomarkers for checkpoint inhibitor-based immunotherapy. The Lancet Oncology. 2016, 17(12): e542-e51. |
| [5] | Lijun L, Daxia C, Yi W. Bioinformatics Analysis Identifies Potential Key Genes of Peripheral Blood Mononuclear Cell in Idiopathic Pulmonary Fibrosis. Computational Biology and Bioinformatics. 2020, 8(2): 77-89. |
| [6] | Saeed A, Hildebrand H, Park R, Al-Jumayli M, Abbasi S, Melancon T, et al. Immune Checkpoint Inhibitors versus VEGF Targeted Therapy as Second Line Regimen in Advanced Hepatocellular Carcinoma (HCC): A Retrospective Study. J Clin Med. 2020, 9(9). |
| [7] | Corpet A, De Koning L, Toedling J, Savignoni A, Berger F, Lemaître C, et al. Asf1b, the necessary Asf1 isoform for proliferation, is predictive of outcome in breast cancer. The EMBO Journal. 2011, 30(3): 480-93. |
| [8] | Liu X, Song J, Zhang Y, Wang H, Sun H, Feng X, et al. ASF1B promotes cervical cancer progression through stabilization of CDK9. Cell Death Dis. 2020, 11(8): 705. |
| [9] | Liu Z, Yang L, Sun Y, Xie X, Huang J. ASF1a enhances antiviral immune response by associating with CBP to mediate acetylation of H3K56 at the Ifnb promoter. Molecular Immunology. 2016, 7857-64. |
| [10] | Azimi F, Scolyer RA, Rumcheva P, Moncrieff M, Murali R, McCarthy SW, et al. Tumor-infiltrating lymphocyte grade is an independent predictor of sentinel lymph node status and survival in patients with cutaneous melanoma. J Clin Oncol. 2012, 30(21): 2678-83. |
| [11] | Guo S, Deng CX. Effect of Stromal Cells in Tumor Microenvironment on Metastasis Initiation. Int J Biol Sci. 2018, 14(14): 2083-93. |
| [12] | Hinshaw DC, Shevde LA. The Tumor Microenvironment Innately Modulates Cancer Progression. Cancer Res. 2019, 79(18): 4557-66. |
| [13] | Wu T, Dai Y. Tumor microenvironment and therapeutic response. Cancer Lett. 2017, 38761-8. |
| [14] | Roessler S, Jia HL, Budhu A, Forgues M, Ye QH, Lee JS, et al. A unique metastasis gene signature enables prediction of tumor relapse in early-stage hepatocellular carcinoma patients. Cancer Res. 2010, 70(24): 10202-12. |
| [15] | Deng YB, Nagae G, Midorikawa Y, Yagi K, Tsutsumi S, Yamamoto S, et al. Identification of genes preferentially methylated in hepatitis C virus-related hepatocellular carcinoma. Cancer Sci. 2010, 101(6): 1501-10. |
| [16] | Lamb JR, Zhang C, Xie T, Wang K, Zhang B, Hao K, et al. Predictive genes in adjacent normal tissue are preferentially altered by sCNV during tumorigenesis in liver cancer and may rate limiting. PLoS One. 2011, 6(7): e20090. |
| [17] | Wang H-W, Hsieh T-H, Huang S-Y, Chau G-Y, Tung C-Y, Su C-W, et al. Forfeited hepatogenesis program and increased embryonic stem cell traits in young hepatocellular carcinoma (HCC) comparing to elderly HCC. BMC Genomics. 2013, 14736. |
| [18] | Melis M, Diaz G, Kleiner DE, Zamboni F, Kabat J, Lai J, et al. Viral expression and molecular profiling in liver tissue versus microdissected hepatocytes in hepatitis B virus - associated hepatocellular carcinoma. Journal of Translational Medicine. 2014, 12230. |
| [19] | Wang Y-H, Cheng T-Y, Chen T-Y, Chang K-M, Chuang VP, Kao K-J. Plasmalemmal Vesicle Associated Protein (PLVAP) as a therapeutic target for treatment of hepatocellular carcinoma. BMC Cancer 2014, 14815. |
| [20] | Schulze K, Imbeaud S, Letouze E, Alexandrov LB, Calderaro J, Rebouissou S, et al. Exome sequencing of hepatocellular carcinomas identifies new mutational signatures and potential therapeutic targets. Nat Genet. 2015, 47(5): 505-11. |
| [21] | Chaisaingmongkol J, Budhu A, Dang H, Rabibhadana S, Pupacdi B, Kwon SM, et al. Common Molecular Subtypes Among Asian Hepatocellular Carcinoma and Cholangiocarcinoma. Cancer Cell. 2017, 32(1): 57-70 e3. |
| [22] | Liu G, Hou G, Li L, Li Y, Zhou W, Liu L. Potential diagnostic and prognostic marker dimethylglycine dehydrogenase (DMGDH) suppresses hepatocellular carcinoma metastasis in vitro and in vivo. Oncotarget. 2016, 2(22): 32607-16. |
| [23] | Wang H, Huo X, Yang XR, He J, Cheng L, Wang N, et al. STAT3-mediated upregulation of lncRNA HOXD-AS1 as a ceRNA facilitates liver cancer metastasis by regulating SOX4. Mol Cancer. 2017, 16(1): 136. |
| [24] | Funk K, Czauderna C, Klesse R, Becker D, Hajduk J, Oelgeklaus A, et al. BAX Redistribution Induces Apoptosis Resistance and Selective Stress Sensitivity in Human HCC. Cancers (Basel). 2020, 12(6). |
| [25] | Woo HG, Choi JH, Yoon S, Jee BA, Cho EJ, Lee JH, et al. Integrative analysis of genomic and epigenomic regulation of the transcriptome in liver cancer. Nat Commun. 2017, 8(1): 839. |
| [26] | Shimada S, Mogushi K, Akiyama Y, Furuyama T, Watanabe S, Ogura T, et al. Comprehensive molecular and immunological characterization of hepatocellular carcinoma. EBioMedicine. 2019, 40457-70. |
| [27] | Wang SM, Ooi LL, Hui KM. Identification and validation of a novel gene signature associated with the recurrence of human hepatocellular carcinoma. Clin Cancer Res. 2007, 13(21): 6275-83. |
| [28] | Liu XS, Li B, Chen Q, Li J, Cohen D, Zeng Z, et al. TIMER2.0 for analysis of tumor-infiltrating immune cells. Nucleic Acids Research. 2020, 48(W1): W509-W14. |
| [29] | Tang Z, Kang B, Li C, Chen T, Zhang Z. GEPIA2: an enhanced web server for large-scale expression profiling and interactive analysis. Nucleic Acids Res. 2019, 47(W1): W556-W60. |
| [30] | Szklarczyk D, Gable AL, Lyon D, Junge A, Wyder S, Huerta-Cepas J, et al. STRING v11: protein-protein association networks with increased coverage, supporting functional discovery in genome-wide experimental datasets. Nucleic Acids Res. 2019, 47(D1): D607-D13. |
| [31] | Zhou Y, Zhou B, Pache L, Chang M, Khodabakhshi AH, Tanaseichuk O, et al. Metascape provides a biologist-oriented resource for the analysis of systems-level datasets. Nat Commun. 2019, 10(1): 1523. |
| [32] | De Koning L, Corpet A, Haber JE, Almouzni G. Histone chaperones: an escort network regulating histone traffic. Nat Struct Mol Biol. 2007, 14(11): 997-1007. |
| [33] | Seol JH, Song TY, Oh SE, Jo C, Choi A, Kim B, et al. Identification of small molecules that inhibit the histone chaperone Asf1 and its chromatin function. BMB Rep. 2015, 48(12): 685-90. |
| [34] | Abascal F, Corpet A, Gurard-Levin ZA, Juan D, Ochsenbein F, Rico D, et al. Subfunctionalization via adaptive evolution influenced by genomic context: the case of histone chaperones ASF1a and ASF1b. Mol Biol Evol. 2013, 30(8): 1853-66. |
| [35] | Galvani A, Courbeyrette R, Agez M, Ochsenbein F, Mann C, Thuret JY. In vivo study of the nucleosome assembly functions of ASF1 histone chaperones in human cells. Mol Cell Biol. 2008, 28(11): 3672-85. |
| [36] | Lario LD, Ramirez-Parra E, Gutierrez C, Spampinato CP, Casati P. ANTI-SILENCING FUNCTION1 proteins are involved in ultraviolet-induced DNA damage repair and are cell cycle regulated by E2F transcription factors in Arabidopsis. Plant Physiol. 2013, 162(2): 1164-77. |
| [37] | Lee KY, Im JS, Shibata E, Dutta A. ASF1a Promotes Non-homologous End Joining Repair by Facilitating Phosphorylation of MDC1 by ATM at Double-Strand Breaks. Mol Cell. 2017, 68(1): 61-75 e5. |
| [38] | Han G, Zhang X, Liu P, Yu Q, Li Z, Yu Q, et al. Knockdown of anti-silencing function 1B histone chaperone induces cell apoptosis via repressing PI3K/Akt pathway in prostate cancer. Int J Oncol. 2018, 53(5): 2056-66. |
| [39] | Feng Z, Zhang J, Zheng Y, Wang Q, Min X, Tian T. Elevated expression of ASF1B correlates with poor prognosis in human lung adenocarcinoma. Future Medicine. 2021, 18(2): 115-27. |
| [40] | Chen P, Zhang Z, Chen X. Overexpression of PKMYT1 Facilitates Tumor Development and Is Correlated with Poor Prognosis in Clear Cell Renal Cell Carcinoma. Medical science monitor. 2020, 7(26): e926755. |
| [41] | Uzquiano A, Gladwyn-Ng I, Nguyen L, Reiner O, Götz M, Matsuzaki F, et al. Cortical progenitor biology: key features mediating proliferation versus differentiation. J Neurochem. 2018, 146(5): 500-25. |
| [42] | Torres RG, Casanova L, Carvalho J, Marcondes MC, Costa SS, Sola-Penna M, et al. Ocimum basilicum but not Ocimum gratissimum present cytotoxic effects on human breast cancer cell line MCF-7, inducing apoptosis and triggering mTOR/Akt/p70S6K pathway. J Bioenerg Biomembr. 2018, 50(2): 93-105. |
| [43] | Rohr-Udilova N, Klinglmüller F, Schulte-Hermann R, Stift J, Herac M, Salzmann M, et al. Deviations of the immune cell landscape between healthy liver and hepatocellular carcinoma. Sci Rep. 2018, 8(1): 6220. |
| [44] | Siegel RL, Miller KD, Jemal A. Cancer statistics, 2019. CA Cancer J Clin. 2019, 69(1): 7-34. |
| [45] | Sokratous G, Polyzoidis S, Ashkan K. Immune infiltration of tumor microenvironment following immunotherapy for glioblastoma multiforme. Hum Vaccin Immunother. 2017, 13(11): 2575-82. |
| [46] | Blanc C, Hans S, Tran T, Granier C, Saldman A, Anson M, et al. Targeting Resident Memory T Cells for Cancer Immunotherapy. Front Immunol. 2018, 91722. |
| [47] | Walsh SR, Simovic B, Chen L, Bastin D, Nguyen A, Stephenson K, et al. Endogenous T cells prevent tumor immune escape following adoptive T cell therapy. J Clin Invest. 2019, 129(12): 5400-10. |
| [48] | Wei J, Marisetty A, Schrand B, Gabrusiewicz K, Hashimoto Y, Ott M, et al. Osteopontin mediates glioblastoma-associated macrophage infiltration and is a potential therapeutic target. J Clin Invest. 2019, 129(1): 137-49. |
| [49] | Wang Y, Shen Y, Wang S, Shen Q, Zhou X. The role of STAT3 in leading the crosstalk between human cancers and the immune system. Cancer Lett. 2018, 415117-28. |
| [50] | Takeuchi Y, Nishikawa H. Roles of regulatory T cells in cancer immunity. Int Immunol. 2016, 28(8): 401-9. |
| [51] | Zarour HM. Reversing T-cell Dysfunction and Exhaustion in Cancer. Clin Cancer Res. 2016, 22(8): 1856-64. |
| [52] | Papadopoulos P, Kafasi A, De Cuyper IM, Barroca V, Lewandowski D, Kadri Z, et al. Mild dyserythropoiesis and beta-like globin gene expression imbalance due to the loss of histone chaperone ASF1B. Hum Genomics. 2020, 14(1): 39. |
| [53] | Jasencakova Z, Scharf AN, Ask K, Corpet A, Imhof A, Almouzni G, et al. Replication stress interferes with histone recycling and predeposition marking of new histones. Mol Cell. 2010, 37(5): 736-43. |
| [54] | Paul PK, Rabaglia ME, Wang CY, Stapleton DS, Leng N, Kendziorski C, et al. Histone chaperone ASF1B promotes human beta-cell proliferation via recruitment of histone H3.3. Cell Cycle. 2016, 15(23): 3191-202. |
| [55] | Ricketts MD, Marmorstein R. A Molecular Prospective for HIRA Complex Assembly and H3.3-Specific Histone Chaperone Function. J Mol Biol. 2017, 429(13): 1924-33. |
| [56] | Segura-Bayona S, Stracker TH. The Tousled-like kinases regulate genome and epigenome stability: implications in development and disease. Cell Mol Life Sci. 2019, 76(19): 3827-41. |
APA Style
Tian, F., Chen, Q., Li, J., Wang, Y., Tu, J., et al. (2026). ASF1B Serves as a Potential Prognostic Biomarker and Correlates with Immune Infiltration in Hepatocellular Carcinoma. Cancer Research Journal, 14(2), 42-58. https://doi.org/10.11648/j.crj.20261402.13
ACS Style
Tian, F.; Chen, Q.; Li, J.; Wang, Y.; Tu, J., et al. ASF1B Serves as a Potential Prognostic Biomarker and Correlates with Immune Infiltration in Hepatocellular Carcinoma. Cancer Res. J. 2026, 14(2), 42-58. doi: 10.11648/j.crj.20261402.13
@article{10.11648/j.crj.20261402.13,
  author = {Feng Tian and Qiyi Chen and Jun Li and Yonghui Wang and Jianfei Tu and Xingdong Cai and Daxia Cai},
  title = {ASF1B Serves as a Potential Prognostic Biomarker and Correlates with Immune Infiltration in Hepatocellular Carcinoma},
  journal = {Cancer Research Journal},
  volume = {14},
  number = {2},
  pages = {42-58},
  doi = {10.11648/j.crj.20261402.13},
  url = {https://doi.org/10.11648/j.crj.20261402.13},
  eprint = {https://article.sciencepublishinggroup.com/pdf/10.11648.j.crj.20261402.13},
  abstract = {Hepatocellular carcinoma (HCC) is the third leading cause of cancer-related death, and anti-silencing function 1B histone chaperone (ASF1B) has been implicated in several cancers. This study aimed to investigate the role and molecular mechanism of ASF1B in HCC. ASF1B expression was analyzed using the TIMER2, GEO, Oncomine, and GEPIA2 databases, as well as western blotting. Cell viability, cell cycle distribution, and apoptosis were assessed via CCK-8 assay and flow cytometry, respectively. Survival analysis and immune infiltration analysis were performed using the TIMER2 database, and enrichment analysis was conducted via Metascape. Results showed that ASF1B expression was significantly higher in HCC tissues than in normal tissues, and high ASF1B expression predicted poor prognosis and was associated with higher tumor stage. Knockdown of ASF1B by siRNA significantly reduced cell viability, promoted apoptosis, and induced G1 phase cell cycle arrest in SNU-423 cells. Moreover, ASF1B expression was positively correlated with the infiltration levels of immune cells and tumor microenvironment signature cells, particularly functional T cells. Enrichment analysis further indicated that ASF1B may contribute to HCC progression through mechanisms involving cell cycle, cell division and differentiation, and DNA replication and repair. Collectively, these findings suggest that ASF1B overexpression predicts poor prognosis and increased immune infiltration in HCC, highlighting ASF1B as a potential therapeutic target for this malignancy.},
 year = {2026}
}
TY  - JOUR
T1  - ASF1B Serves as a Potential Prognostic Biomarker and Correlates with Immune Infiltration in Hepatocellular Carcinoma
AU  - Feng Tian
AU  - Qiyi Chen
AU  - Jun Li
AU  - Yonghui Wang
AU  - Jianfei Tu
AU  - Xingdong Cai
AU  - Daxia Cai
Y1  - 2026/06/12
PY  - 2026
N1  - https://doi.org/10.11648/j.crj.20261402.13
DO  - 10.11648/j.crj.20261402.13
T2  - Cancer Research Journal
JF  - Cancer Research Journal
JO  - Cancer Research Journal
SP  - 42
EP  - 58
PB  - Science Publishing Group
SN  - 2330-8214
UR  - https://doi.org/10.11648/j.crj.20261402.13
AB  - Hepatocellular carcinoma (HCC) is the third leading cause of cancer-related death, and anti-silencing function 1B histone chaperone (ASF1B) has been implicated in several cancers. This study aimed to investigate the role and molecular mechanism of ASF1B in HCC. ASF1B expression was analyzed using the TIMER2, GEO, Oncomine, and GEPIA2 databases, as well as western blotting. Cell viability, cell cycle distribution, and apoptosis were assessed via CCK-8 assay and flow cytometry, respectively. Survival analysis and immune infiltration analysis were performed using the TIMER2 database, and enrichment analysis was conducted via Metascape. Results showed that ASF1B expression was significantly higher in HCC tissues than in normal tissues, and high ASF1B expression predicted poor prognosis and was associated with higher tumor stage. Knockdown of ASF1B by siRNA significantly reduced cell viability, promoted apoptosis, and induced G1 phase cell cycle arrest in SNU-423 cells. Moreover, ASF1B expression was positively correlated with the infiltration levels of immune cells and tumor microenvironment signature cells, particularly functional T cells. Enrichment analysis further indicated that ASF1B may contribute to HCC progression through mechanisms involving cell cycle, cell division and differentiation, and DNA replication and repair. Collectively, these findings suggest that ASF1B overexpression predicts poor prognosis and increased immune infiltration in HCC, highlighting ASF1B as a potential therapeutic target for this malignancy.
VL  - 14
IS  - 2
ER  -
Cancer Center, Lishui Central Hospital, The Fifth Affiliated Hospital of Wenzhou Medical University, Lishui, China;Department of Pulmonary and Critical Care Medicine, The First Affiliated Hospital of Jinan University, Guangzhou, China
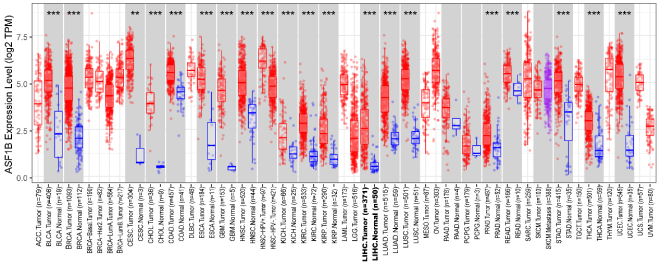
Figure 1. The expression levels of ASF1B in different cancer types were determined by TIMER2.0. BLCA, bladder urothelial carcinoma; BRCA, breast invasive carcinoma; CESC, Cervical squamous cell carcinoma and endocervical adenocarcinoma; CHOL, Cholangiocarcinoma; COAD, colon adenocarcinoma; ESCA, Esophageal carcinoma; GBM, Glioblastoma multiforme; HNSC, Head and Neck squamous cell carcinoma; KICH, kidney chromophobe; KIRC, kidney renal clear cell carcinoma; KIRP, kidney renal papillary cell carcinoma; LIHC, liver hepatocellular carcinoma; LUAD, lung adenocarcinoma; LUSC, lung squamous cell carcinoma; PRAD, Prostate adenocarcinoma; READ, Rectum adenocarcinoma; STAD, Stomach adenocarcinoma; THCA, thyroid carcinoma; UCEC, uterine corpus endometrial carcinoma. *** p <.001, ** p <.01, * p<.05.
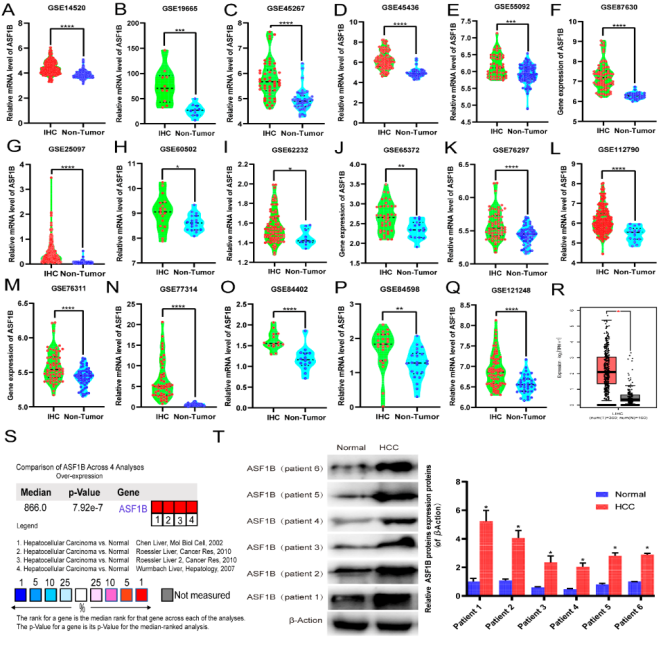
Figure 2. ASF1B is highly expressed in hepatocellular carcinoma (HCC). (A-R) ASF1B mRNA expression levels between tumor and nontumor tissues in HCC patients in GEO database series including GSE14520(A), GSE19665(B), GSE45267(C), GSE45436(D), GSE55092(E), GSE87630(F), GSE25097(G), GSE60502(H), GSE62232(I), GSE65372(J), GSE76297(K), GSE112790(L), GSE76311(M), GSE77314(N), GSE84402(O), GSE84598(P), GSE121248(Q) and GEPIA2 database (R). (S) Meta-analysis of ASF1B mRNA expression levels in 4 analyses using Oncomine database. (T) Western blotting was performed to evaluate the protein expression of ASF1B in HCC tissues (relative to the internal control, β-Action) vs. normal (healthy adjacent liver tissues). *** p < 0.001, ** p < 0.01, * p< 0.05.
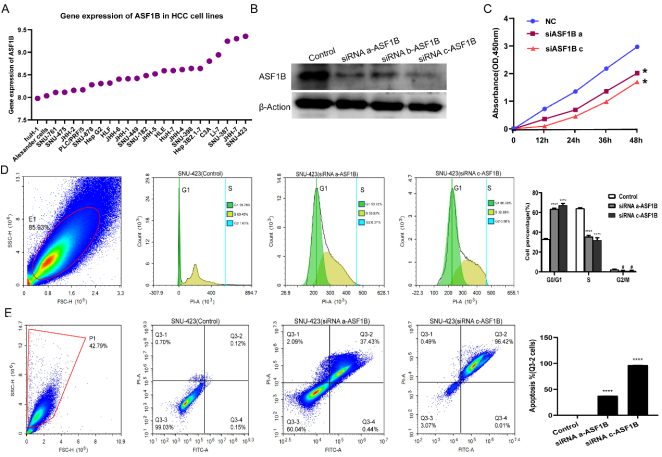
Figure 3. Expression of ASF1B in HCC cell lines, and effects of downregulation of ASF1B on the proliferation, cell cycle and apoptosis of SNU-423 cells. (A) Expression of ASF1B in HCC cell lines. (B) Protein expression of ASF1B protein in SNU-423 cells after treatment with siRNAs-ASF1B. (C) The effect of ASF1B downregulation on proliferation. (D) Downregulation of ASF1B leads to a marked increase in G1-phase cells and a marked decrease in cells in the S phase. (E) The effect of ASF1B downregulation on cell apoptosis of SNU-423 cells. *** p < 0.001, ** p < 0.01, * p< 0.05, #P>0.05 vs. control. ASF1B, anti-silencing function 1B histone chaperone; siRNA, small inteferring RNA.
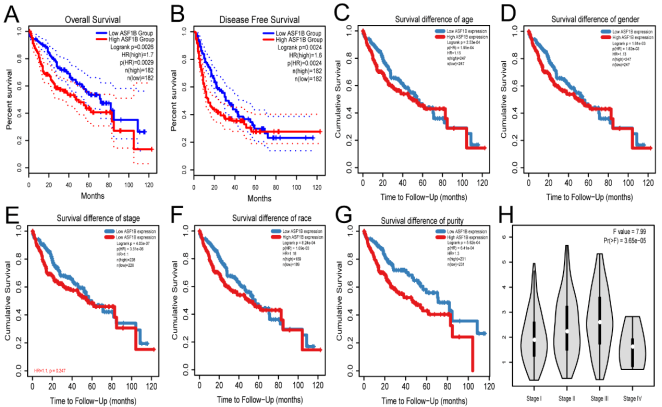
Figure 4. Relationship between high expression of ASF1B and prognosis of HCC patients with different clinical characteristics (A-G) and clinical staging (H) of HCC patients. Overall survival (A) and disease-free survival (B) of HCC patients in GEPIA2 database. Subgroup analyses of overall survival comparison in different population [age(C), gender (D), stage (E), race (F) and purity (G)] with ASF1B expressed in HCC patients through TIMER2.0 database.
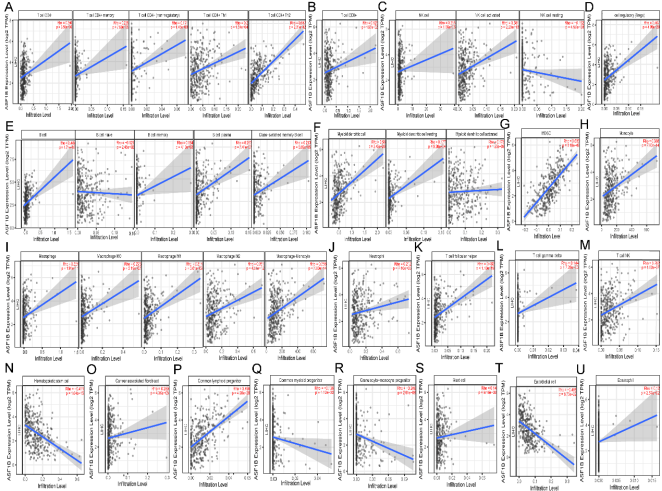
Figure 5. Correlation of ASF1B expression with immune infiltration level in HCC. (A) ASF1B expression is significantly positive correlations with CD4+ T cell, Memory CD4+ T cell, non-regulatory CD4+ T cell, Th1 CD4+ T cell and Th2 CD4+ T cell. (B) ASF1B expression is significantly positively related to the infiltrating levels of CD8+ T cell. (C) ASF1B expression is significantly positively correlations with infiltrating levels of NK cell, activated NK cell, and significantly negatively correlations with resting NK cell. (D) ASF1B expression is significantly positively related to the infiltrating levels of Tregs. (E) ASF1B expression is significantly positively related to the infiltrating levels of B cell, memory B cell, plasma B cell, class-switched memory B cell and has significant negative correlations with infiltrating levels of native B cell in HCC. (F) ASF1B expression is significantly positively related to myeloid dendritic cell, resting myeloid dendritic cell, and activated myeloid dendritic cell. (G-H) ASF1B expression is significantly positively related to MDSC and Monocyte. (I) ASF1B expression is significantly positively related to macrophage, macrophage M0, macrophage M1, macrophage M2, and macrophage-monocyte. (J-M) ASF1B expression is significantly positively related to Neutrophil, T cell follicular helper, T cell gamma delta, and T cell NK. (N) (N-U) ASF1B expression is significantly negatively related to hematopoietic stem cell(N), common myeloid progenitor(Q), granulocyte-monocyte progenitor(R), and endothelial cell(T), but positively related to cancer associated fibroblast(O), common lymphoid progenitor(P), mast cell(S) and eosinophil(U). HCC, hepatocellular carcinoma; MDSC, myeloid derived suppressor cells; Th, T helper cell; Tfh, Follicular helper T cell; Treg, regulatory T cell.
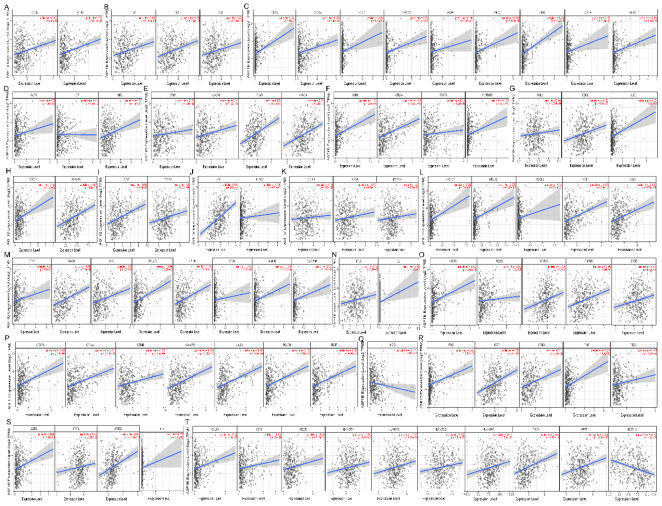
Figure 6. ASF1B expression correlated with immune markers in HCC. Markers include: CD8A and CD8B of CD8+ T cell(A); CD2, CD3D and CD3E of T cell (general)(B); CD19, CD79A, FCRL2, KIAA0125, MS4A1, PNOC, SPIB, TCL1A, and TNFRSF17 of B cell(C); CCR7, IL7R and SELL of Central memory T cell(D); CD69, CXCR6, ITGAE, and MYADM of Resident memory T cell(E); CCR8, CTLA4, FOXP3, and TNFRSF9(F); CCL2, CD68, and IL10 of TAM(G); CX3CR1 and FCGR3A of FCGR3A(H); CD86 and CD115 (CSF1R) of Monocyte(I); IRF5 and COX2(PTGS2) of M1 Macrophage(J); CD163, VSIG4, and MS4A4A of M2 Macrophage(K); KIR2DL3, KIR2DL4, KIR3DL2, XCL1, and XCL2 of Natural killer cell(L); CCR7, CD11b (ITGAM), FPR1, SIGLEC5, CSF3R, FCAR, FCGR3B, and CEACAM3 of Neutrophils(M); BCL6 and IL21 of Tfh(N); CCR8, FOXP3, STAT5B, TGFβ (TGFB1), and STAT3 of Treg(O); PDL1(CD274), CTLA4, GZMB, TIM-3 (HAVCR2), LAG3, PD-1 (PDCD1), and TIGIT of T cell exhaustion(P); HDC of Mast cell(Q); IFN-γ (IFNG), STAT1, STAT4, TNF-α (TNF), and T-bet (TBX21) of Th1(R); GATA3, STAT6, STAT5A, and IL13 of Th2(S); CCL13, BDCA-1(CD1C), CD209, HLA-DPA1, HLA-DPB1, HLA-DQB1, HLA-DRA, CD11c (ITGAX), BDCA-4(NRP1), and HSD11B1 of Dendritic cell(T). HCC, hepatocellular carcinoma; TAM, tumor-associated macrophage; Th, T helper cell; Tfh, Follicular helper T cell; Treg, regulatory T cell.
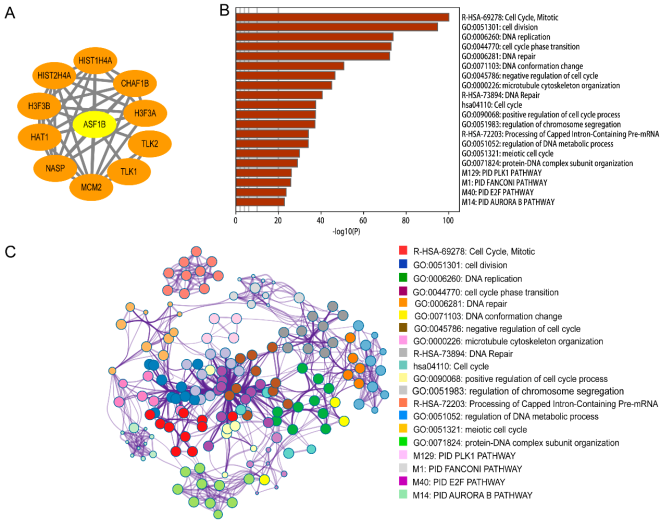
Figure 7. Protein-protein interaction of ASF1B using String analysis (A); The visualized networks of functional enrichment of the top 500 genes that expressed similar ASF1B in HCC, then each node represents an enriched term and is colored first by its p-value(B) and by its cluster ID (C).
Information