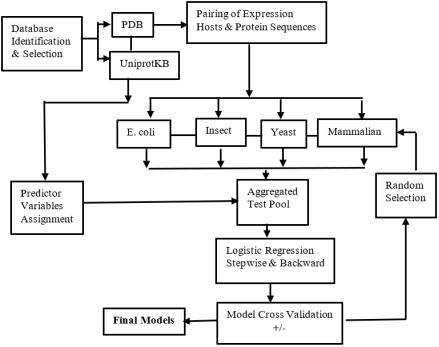
Selection of an appropriate host cell is a critical determinant of success in recombinant protein expression. In practice, host choice is still largely guided by individual experience, ad hoc consultation of the literature, and intuitive decision-making, often resulting in suboptimal expression outcomes and costly cycles of experimental trial and error. Despite several decades of accumulated empirical knowledge in the field, there is currently no systematic, evidence-based framework for forecasting host cell suitability from protein sequence and structural characteristics. The purpose of this study was to develop predictive models that enable rational selection of host cells for recombinant protein expression based on intrinsic protein features. To achieve this, we leveraged collective experimental experience embedded in publicly available structural data. Protein entries from the Protein Data Bank were curated and analyzed, and logistic regression approaches were applied to relate expression outcomes to a range of protein attributes, including structural parameters, stability indices, predicted subcellular localization, and post-translational modification requirements. Using these variables, we constructed and validated statistical models capable of forecasting expression preferences across four commonly used host systems: Escherichia coli, insect cells, mammalian cells, and yeast. Model performance was assessed using internal validation procedures, demonstrating that distinct combinations of protein features are associated with differential expression success among host types. In conclusion, this work provides an evidence-based and quantitative framework for predicting suitable host cells for recombinant protein expression. By translating accumulated empirical knowledge into practical predictive tools, the proposed models reduce reliance on subjective judgment and trial-and-error experimentation. To facilitate broad adoption, the models, together with user guidance, have been implemented in a publicly accessible web server, offering a practical resource to improve experimental efficiency and success rates in protein expression studies.
| Published in | Biochemistry and Molecular Biology (Volume 11, Issue 1) |
| DOI | 10.11648/j.bmb.20261101.11 |
| Page(s) | 1-13 |
| Creative Commons |
This is an Open Access article, distributed under the terms of the Creative Commons Attribution 4.0 International License (http://creativecommons.org/licenses/by/4.0/), which permits unrestricted use, distribution and reproduction in any medium or format, provided the original work is properly cited. |
| Copyright |
Copyright © The Author(s), 2026. Published by Science Publishing Group |
Recombinant Protein Expression, Host Cell Selection, Logistic Regression, Predictive Modeling
Expression host distribution in PDB* | 156,140 |
|---|---|
Prokaryote expression | 135,653 |
E. coli | 134,513 |
Others | 1,140 |
Eukaryote expression | 20,487 |
Insect | 9,637 |
Mammalian | 7,186 |
Yeast | 3,165 |
Fungus | 418 |
Plant | 56 |
Protozoa | 25 |
Structural and membrane class definition* | |
|---|---|
Tertiary structural classes (t) | Numerical coding |
Small protein (sp) | 1 |
All alpha (α) | 2 |
All beta (β) | 3 |
Alternating alpha/beta (α/β) | 4 |
Segregated alpha and beta (α+β) | 5 |
Quaternary structural classes (q) | Numerical coding |
Monomer | 1 |
Homopolymer, nth order | 2 |
Homopolymer, undefined size | 3 |
Heteropolymer. nth order | 4 |
Heteropolymer, undefined size | 5 |
State of membrane association (m) | Numerical coding |
None | 0 |
Transmembrane helices, nth order | 1 |
Membrane associated | 2 |
Molecular function* | Numerical coding |
|---|---|
Antioxidant | 1 |
Binding | 2 |
Catalytic | 3 |
Hijacked molecular function | 4 |
Molecular carrier activity | 5 |
Molecular function regulator | 6 |
Molecular transducer activity | 7 |
Nutrient reservoir activity | 8 |
Protein tag | 9 |
Signal transducer activity | 10 |
Structural molecule activity | 11 |
Toxin activity | 12 |
Transcription regulator activity | 13 |
Translation regulator activity | 14 |
Transporter activity | 15 |
Coefficient | SE | P-value | OR | OR 95% CI | ||
|---|---|---|---|---|---|---|
Lower | Upper | |||||
Intercept | 0.822 | 0.443 | 0.064 | 2.275 | 0.954 | 5.423 |
r | -0.003 | 0.001 | 2.1E-08 | 0.997 | 0.996 | 0.998 |
pI | -0.128 | 0.049 | 0.009 | 0.880 | 0.780 | 0.969 |
t | 0.238 | 0.064 | 4.0E-04 | 1.268 | 1.118 | 1.438 |
q | -0.352 | 0.063 | 2.8E-08 | 0.703 | 0.621 | 0.796 |
ng | -0.209 | 0.054 | 1.1E-04 | 0.811 | 0.730 | 0.902 |
mf | 0.048 | 0.023 | 0.036 | 1.049 | 1.003 | 1.097 |
Coefficient | SE | P-value | OR | OR 95% CI | ||
|---|---|---|---|---|---|---|
Lower | Upper | |||||
Intercept | -3.204 | 0.480 | 2.5E-11 | 0.041 | 0.016 | 0.104 |
r | 0.001 | 2.0E-04 | 0.002 | 1.001 | 1.000 | 1.001 |
hp | 1.128 | 0.323 | 5.0E-04 | 3.089 | 1.641 | 5.812 |
ii | 0.038 | 0.008 | 3.9E-06 | 1.039 | 1.022 | 1.056 |
t | 0.323 | 0.070 | 3.9E-06 | 1.381 | 1.204 | 1.583 |
m | 0.381 | 0.167 | 0.023 | 1.463 | 1.054 | 2.031 |
q | -0.158 | 0.062 | 0.011 | 0.854 | 0.756 | 0.965 |
mf | -0.101 | 0.030 | 0.001 | 0.904 | 0.852 | 0.960 |
Coefficient | SE | P-value | OR | OR 95% CI | ||
|---|---|---|---|---|---|---|
Lower | Upper | |||||
Intercept | -1.977 | 0.567 | 0.001 | 0.138 | 0.046 | 0.421 |
r | -0.002 | 4.0E-04 | 2.0E-04 | 0.999 | 0.998 | 0.999 |
pI | 0.125 | 0.054 | 0.020 | 1.133 | 1.020 | 1.259 |
ii | 0.025 | 0.008 | 0.002 | 1.025 | 1.009 | 1.041 |
t | -0.334 | 0.072 | 3.6E-06 | 0.716 | 0.621 | 0.825 |
m | -0.834 | 0.282 | 0.003 | 0.434 | 0.250 | 0.755 |
q | 0.343 | 0.064 | 8.0E-08 | 1.409 | 1.243 | 1.598 |
ng | 0.243 | 0.039 | 2.8E-10 | 1.275 | 1.182 | 1.375 |
mf | -0.152 | 0.039 | 9.1E-05 | 0.859 | 0.797 | 0.927 |
Coefficient | SE | P-value | OR | OR 95% CI | ||
|---|---|---|---|---|---|---|
Lower | Upper | |||||
Intercept | -0.798 | 0.352 | 0.023 | 0.450 | 0.226 | 0.898 |
r | 0.002 | 3.0E-04 | 5.1E-06 | 1.002 | 1.001 | 1.002 |
ii | -0.046 | 0.009 | 1.1E-07 | 0.955 | 0.939 | 0.972 |
m | 0.392 | 0.167 | 0.019 | 1.480 | 1.068 | 2.051 |
q | 0.171 | 0.065 | 0.009 | 1.186 | 1.045 | 1.347 |
ng | -0.083 | 0.041 | 0.042 | 0.920 | 0.849 | 0.997 |
mf | 0.096 | 0.023 | 1.8E-05 | 1.101 | 1.054 | 1.151 |
Expression host | Logit model |
|---|---|
E. coli | logit(p) = 0.822 - 0.003r - 0.128pI + 0.238t - 0.352q - 0.209ng + 0.048mf |
Insect | logit(p) = -3.204 + 0.001r + 1.128hp + 0.038ii + 0.323t + 0.381m - 0.158q - 0.101mf |
Mammalian | logit(p) = -1.977 - 0.002r + 0.125pI + 0.025ii - 0.334t- 0.834m + 0.343q + 0.243ng - 0.152mf |
Yeast | logit(p) = -0.798 + 0.002r - 0.046ii + 0.392m + 0.171q - 0.083ng + 0.096mf |
Expression host | Probability average (Variance) | F-Statistics* | ||
|---|---|---|---|---|
Training set* | Test set* | F | P value | |
E. coli | 0.3548 (0.0260) | 0.4116 (0.0243) | 1.6001 | 0.2120 |
Insect | 0.3316 (0.0177) | 0.2956 (0.0206) | 0.8460 | 0.3623 |
Mammalian | 0.3568 (0.0302) | 0.3108 (0.0259) | 0.9422 | 0.3366 |
Yeast | 0.3468 (0.0412) | 0.4284 (0.0542) | 1.7423 | 0.1931 |
MER23_ | METJ_ | Mfsd4 | metAS | mapk1 | |
|---|---|---|---|---|---|
EUPRA | ECO27 | Naglt1 | Spea | mpk1 | |
Expression host | |||||
E. coli | 0.50 (1) | 0.55 (1) | 0.18 (1) | 0.35 (1) | 0.21 (1) |
Insect | 0.13 (0.26) | 0.03 (0.05) | 0.24 (1.39) | 0.28 (0.80) | 0.26 (1.28) |
Mammalian | 0.31 (0.62) | 0.07 (0.12) | 0.03 (0.17) | 0.17 (0.48) | 0.19 (0.90) |
Yeast | 0.11 (0.21) | 0.36 (0.65) | 0.48 (2.72) | 0.14 (0.40) | 0.28 (1.37) |
PDB | Protein Data Bank |
GRAVY | Kyte-Doolittle Grand Average of Hydropathicity |
SIB | Swiss Institute of Bioinformatics |
SCOP | Structural Classification of Protein |
UniProtKB | Universal Protein Knowledgebase |
DTU | Technical University of Denmark |
GPI | Glycosyl Phospho Inositol |
ANOVA | Analysis of Variance |
GO | Gene Ontology |
| [1] | Cohen SN, Chang ACY, Boyer HW, Helling RB, Construction of biologically functional bacterial plasmids in vitro, Proc Natl Acad Sci USA 70: 3240-3244, 1973. |
| [2] | Chang ACY, Cohen SN, Genome construction between bacterial species in vitro: Replication and expression of Staphylococcus plasmid genes in Escherichia coli, Proc Natl Acad Sci USA 71: 1030-1034, 1974. |
| [3] | Morrow JF, Cohen SN, Chang ACY, Boyer HW, Goodman HM, Helling RB, Replication and transcription of eukaryotic DNA in Escherichia coli, Proc Natl Acad Sci USA 71: 1743-1747, 1974. |
| [4] | Chang CCH, Song J, Tey BT, Ramanan RN, Bioinformatics approaches for improved recombinant protein production in Escherichia coli: protein solubility prediction, Brief Bioinform 15: 953-962, 2013. |
| [5] | Habibi N, Hashim SZM, Norouzi A, Samian MR, A review of machine learning methods to predict the solubility of overexpressed recombinant proteins in Escherichia coli, BMC Bioinform 15: 134, 2014. |
| [6] | Bhandari BK, Gardner PP, Lim CS, Solubility-Weighted Index: fast and accurate prediction of protein solubility, Bioinform 36: 4691-4698, 2020. |
| [7] | Chan W-C, Liang P-H, Shih Y-P, Yang U-C, Lin C-C, Hsu C-N, Learning to predict expression efficacy of vectors in recombinant protein production. 2010. BMC Bioinform 11 (Suppl 1): S21, 2010. |
| [8] | Martiny H-M, Armenteros JJA, Johansen AR, Salomon J, Nielsen H, Deep protein representations enable recombinant protein expression prediction. Comput Biol Chem 95: 107596, 2021. |
| [9] | Bhandari BK, Lim CS, Gardner PP, TISIGNER.com: web services for improving recombinant protein production, Nucleic Acids Res 49: W654-W661, 2021. |
| [10] | Bhandari BK, Lim CS, Remus DM, Chen A, van Dolleweerd C, Gardner PP, Analysis of 11,430 recombinant protein production experiments reveals that protein yield is tunable by synonymous codon changes of translation initiation sites, PLoS Comput Biol 17: e1009461, 2021. |
| [11] | Berman HM, Westbrook J, Feng Z, Gilliland G, Bhat TN, Weissig H, Shindyalov IN, Bourne PE, The Protein Data Bank, Nucleic Acids Res 28: 235-242, 2000. |
| [12] | Hosmer DW, Lemeshow S, Applied Logistic Regression, John Wiley & Sons, New York, 2000. |
| [13] | Kyte J, Doolittle RF, A simple method for displaying the hydropathic character of a protein, J Mol Biol 157: 103-132, 1982. |
| [14] | Guruprasad K, Bhasker Reddy BV, Pandit MW, Correlation between stability of a protein and its dipeptide composition: a novel approach for predicting in vivo stability of a protein from its primary sequence, Protein Eng 4: 155-161, 1990. |
| [15] | Gasteiger E, Hoogland C, Gattiker A, Duvaud S, Wilkins MR, Appel RD, Bairoch A, Protein Identification and Analysis Tools on the ExPASy Server, in Walker JM (ed.), The Proteomics Protocols Handbook, Humana Press, Totowa, NJ, pp 571-607, 2005. |
| [16] | Sehnal D, Bittrich S, Deshpande M, Svobodová R, K. Berka K, V. Bazgier V, S. Velankar S, S. K. Burley SK, J. Koča J, A. S. Rose AJ, Mol* Viewer: modern web app for 3D visualization and analysis of large biomolecular structures, Nucleic Acids Res 49 (W1): W431-W437, 2021. |
| [17] | Jumper J et al., Highly accurate protein structure prediction with AlphaFold, Nature 596: 583-589, 2021. |
| [18] | The UniProt Consortium, UniProt: the universal protein knowledgebase in 2021, Nucleic Acids Res 49: D480-D489, 2021. |
| [19] | Krogh A, Larsson B, von Heijne G, Sonnhammer ELL, Predicting transmembrane protein topology with a hidden Markov model: Application to complete genomes, J Mol Biol 305: 567-580, 2001. |
| [20] | Sonnhammer ELL, von Heijne G, Krogh A, A hidden Markov model for predicting transmembrane helices in protein sequences, in Glasgow J, Littlejohn T, Major F, Lathrop R, Sankoff D, Sensen C (eds.) Proceedings of the Sixth International Conference on Intelligent Systems for Molecular Biology, AAAI Press, Menlo Park, CA, pp 175-182, 1998. |
| [21] | Käll L, Krogh A, Sonnhammer ELL, A Combined Transmembrane Topology and Signal Peptide Prediction Method, J Mol Biol 338: 1027-1036, 2004. |
| [22] | Käll L, Krogh A, Sonnhammer ELL, Advantages of combined transmembrane topology and signal peptide prediction--the Phobius web server, Nucleic Acids Res 35: W429-W432, 2007. |
| [23] | Xie Y, Zheng, Y, Li, H et al., GPS-Lipid: a robust tool for the prediction of multiple lipid modification sites, Sci Rep 6: 28249, 2016. |
| [24] | Eisenhaber B, Bork P, Eisenhaber F, Prediction of potential GPI-modification sites in proprotein sequences, J Mol Biol 292: 741-758, 1999. |
| [25] | Armenteros JJA, Sønderby CK, Sønderby SK, Nielsen H, Winther O, DeepLoc: prediction of protein subcellular localization using deep learning, Bioinform 33: 3387-3395, 2017. |
| [26] | Gupta R, Brunak S, Prediction of glycosylation across the human proteome and the correlation to protein function, Pac Symp Biocomput 7: 310-322, 2001. |
| [27] | Murzin AG, Brenner SE, Hubbard T, Chothia C, SCOP: a structural classification of proteins database for the investigation of sequences and structures, J Mol Biol 247: 536-540, 1995. |
| [28] | Welply JK, ShenbagamurthilI P, Lennarz WJ, Naid F, Substrate recognition by oligosaccharyltransferase: Studies on glycosylation of modified asn-x-thr/ser tripeptides, J Biol Chem 258: 11856-11863, 1983. |
| [29] | Ashburner et al., Gene ontology: tool for the unification of biology, Nat Genet 25: 25-29, 2000. |
| [30] | The Gene Ontology Consortium, The Gene Ontology resource: enriching a GOld mine, Nucleic Acids Res 49: D325-D334, 2021. |
| [31] | Altschul SF, Gish W, Miller W, Myers EW, Lipman DJ. Basic local alignment search tool, J Mol Biol 215: 403-410, 1990. |
| [32] | Price II WN et al., Large-scale experimental studies show unexpected amino acid effects on protein expression and solubility in vivo in E. coli, Microb Inform Exp 1: 6, 2011. |
| [33] | Huang KY, Su MG, Kao HJ, Hsieh YC, Jhong JH, Cheng KH, Huang HD, Lee TY, dbPTM 2016: 10-year anniversary of a resource for post-translational modification of proteins, Nucleic Acids Res 44: D435-D446, 2016. |
APA Style
Le, H. V. (2026). Forecasting Host Cells for Recombinant Protein Expression. Biochemistry and Molecular Biology, 11(1), 1-13. https://doi.org/10.11648/j.bmb.20261101.11
ACS Style
Le, H. V. Forecasting Host Cells for Recombinant Protein Expression. Biochem. Mol. Biol. 2026, 11(1), 1-13. doi: 10.11648/j.bmb.20261101.11
@article{10.11648/j.bmb.20261101.11,
  author = {Hung Van Le},
  title = {Forecasting Host Cells for Recombinant Protein Expression},
  journal = {Biochemistry and Molecular Biology},
  volume = {11},
  number = {1},
  pages = {1-13},
  doi = {10.11648/j.bmb.20261101.11},
  url = {https://doi.org/10.11648/j.bmb.20261101.11},
  eprint = {https://article.sciencepublishinggroup.com/pdf/10.11648.j.bmb.20261101.11},
  abstract = {Selection of an appropriate host cell is a critical determinant of success in recombinant protein expression. In practice, host choice is still largely guided by individual experience, ad hoc consultation of the literature, and intuitive decision-making, often resulting in suboptimal expression outcomes and costly cycles of experimental trial and error. Despite several decades of accumulated empirical knowledge in the field, there is currently no systematic, evidence-based framework for forecasting host cell suitability from protein sequence and structural characteristics. The purpose of this study was to develop predictive models that enable rational selection of host cells for recombinant protein expression based on intrinsic protein features. To achieve this, we leveraged collective experimental experience embedded in publicly available structural data. Protein entries from the Protein Data Bank were curated and analyzed, and logistic regression approaches were applied to relate expression outcomes to a range of protein attributes, including structural parameters, stability indices, predicted subcellular localization, and post-translational modification requirements. Using these variables, we constructed and validated statistical models capable of forecasting expression preferences across four commonly used host systems: Escherichia coli, insect cells, mammalian cells, and yeast. Model performance was assessed using internal validation procedures, demonstrating that distinct combinations of protein features are associated with differential expression success among host types. In conclusion, this work provides an evidence-based and quantitative framework for predicting suitable host cells for recombinant protein expression. By translating accumulated empirical knowledge into practical predictive tools, the proposed models reduce reliance on subjective judgment and trial-and-error experimentation. To facilitate broad adoption, the models, together with user guidance, have been implemented in a publicly accessible web server, offering a practical resource to improve experimental efficiency and success rates in protein expression studies.},
 year = {2026}
}
TY  - JOUR
T1  - Forecasting Host Cells for Recombinant Protein Expression
AU  - Hung Van Le
Y1  - 2026/02/06
PY  - 2026
N1  - https://doi.org/10.11648/j.bmb.20261101.11
DO  - 10.11648/j.bmb.20261101.11
T2  - Biochemistry and Molecular Biology
JF  - Biochemistry and Molecular Biology
JO  - Biochemistry and Molecular Biology
SP  - 1
EP  - 13
PB  - Science Publishing Group
SN  - 2575-5048
UR  - https://doi.org/10.11648/j.bmb.20261101.11
AB  - Selection of an appropriate host cell is a critical determinant of success in recombinant protein expression. In practice, host choice is still largely guided by individual experience, ad hoc consultation of the literature, and intuitive decision-making, often resulting in suboptimal expression outcomes and costly cycles of experimental trial and error. Despite several decades of accumulated empirical knowledge in the field, there is currently no systematic, evidence-based framework for forecasting host cell suitability from protein sequence and structural characteristics. The purpose of this study was to develop predictive models that enable rational selection of host cells for recombinant protein expression based on intrinsic protein features. To achieve this, we leveraged collective experimental experience embedded in publicly available structural data. Protein entries from the Protein Data Bank were curated and analyzed, and logistic regression approaches were applied to relate expression outcomes to a range of protein attributes, including structural parameters, stability indices, predicted subcellular localization, and post-translational modification requirements. Using these variables, we constructed and validated statistical models capable of forecasting expression preferences across four commonly used host systems: Escherichia coli, insect cells, mammalian cells, and yeast. Model performance was assessed using internal validation procedures, demonstrating that distinct combinations of protein features are associated with differential expression success among host types. In conclusion, this work provides an evidence-based and quantitative framework for predicting suitable host cells for recombinant protein expression. By translating accumulated empirical knowledge into practical predictive tools, the proposed models reduce reliance on subjective judgment and trial-and-error experimentation. To facilitate broad adoption, the models, together with user guidance, have been implemented in a publicly accessible web server, offering a practical resource to improve experimental efficiency and success rates in protein expression studies.
VL  - 11
IS  - 1
ER  -
Biologics & Drug Targets, ProSci LLC, Rockaway, The United States
Information