
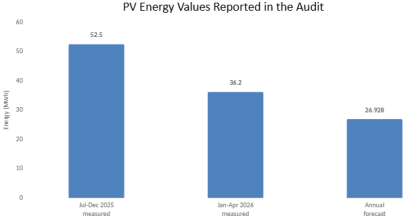
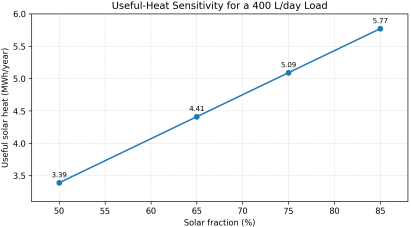
Industrial facilities increasingly combine photovoltaic electricity and solar thermal heat, but audit reports may compare incompatible energy records or aggregate electrical and thermal savings into a single figure. This creates a risk of overstating system performance and double counting displaced energy. This study develops a data-quality-aware measurement and verification methodology for an existing 40 kW rooftop photovoltaic system and a proposed 400 L/day solar water-heating system at an industrial confectionery facility. Audit records were classified by temporal coverage, measurement source, and alternating-current/direct-current boundary; partial-period specific yields were calculated; photovoltaic performance indicators were structured in accordance with IEC 61724-1; useful thermal demand was estimated from the water mass, specific heat capacity, and temperature rise; and a 50-85% solar-fraction sensitivity analysis was integrated with separate electricity and heat ledgers. The audit reports 52.5 MWh for July-December 2025 and 36.2 MWh for January-April 2026, corresponding to partial-period specific yields of 1,312.5 and 905 kWh/kWp. These values cannot be compared directly with a separate 26.928 MWh annual forecast until meter identity, capacity boundary, period completeness, and self-consumption/export allocation are reconciled. For the 400 L load, 18.6 kWh of useful heat is required per cycle, and annual useful solar heat varies from 3.39 to 5.77 MWh over the investigated solar-fraction range. The proposed architecture prevents double counting by maintaining separate physical ledgers and integrating them only at the cost, emissions, or primary-energy layer. Data reconciliation and uncertainty disclosure are therefore prerequisites for credible technical and economic decisions.
| Published in | American Journal of Mechanics and Applications (Volume 13, Issue 4) |
| DOI | 10.11648/j.ajma.20261304.12 |
| Page(s) | 64-71 |
| Creative Commons |
This is an Open Access article, distributed under the terms of the Creative Commons Attribution 4.0 International License (http://creativecommons.org/licenses/by/4.0/), which permits unrestricted use, distribution and reproduction in any medium or format, provided the original work is properly cited. |
| Copyright |
Copyright © The Author(s), 2026. Published by Science Publishing Group |
Photovoltaic Performance Monitoring, Solar Water Heating, Data Reconciliation, Performance Ratio, Solar Fraction, Measurement and Verification, Hybrid Energy Balance
Item | Available information | Evidence limitation |
|---|---|---|
PV system | 40 kW rooftop installation; LONGi modules; Huawei inverter | DC/AC rating and commissioning capacity not confirmed |
PV records | 52.5 MWh for Jul-Dec 2025; 36.2 MWh for Jan-Apr 2026 | Meter ID, completeness, and export/self-use allocation not provided |
PV forecast | 26.928 MWh/year from a screening formula | Scenario assumptions are not equivalent to measured performance |
Solar thermal | 400 L/day; 40°C temperature rise; 75% factor | Collector area, demand profile, and delivered-heat meter not provided |
Record | Coverage | Energy | Specific yield | Classification |
|---|---|---|---|---|
2025 register total | Jul-Dec 2025 | 52.5 MWh | 1,312.5 kWh/kWp | Measured partial period |
2026 register total | Jan-Apr 2026 | 36.2 MWh | 905 kWh/kWp | Measured partial period |
Project estimate | Full-year scenario | 26.928 MWh | 673.2 kWh/kWp | Forecast |
Control | Question | Required evidence |
|---|---|---|
Capacity boundary | Is 40 kW the installed DC or AC rating? | Commissioning record and as-built single-line diagram |
Meter source | Where was generation measured? | Inverter portal and revenue/verification meter ID |
Temporal coverage | Are all intervals and months complete? | Timestamped interval data and completeness ratio |
Energy flow | Are self-consumption and export separated? | Bidirectional import/export balance |
Change history | Was the array or inverter capacity modified? | Asset register and change log |
Reviewer-critical result: the inconsistency is retained as a data-quality finding. No performance-ratio, degradation, or financial claim is made until the evidence boundary is reconciled. | ||
Indicator | Definition | Decision use |
|---|---|---|
Final yield, Y_f | AC energy divided by rated PV capacity | Comparison across capacity and time |
Reference yield, Y_r | Plane-of-array irradiation divided by reference irradiance | Solar-resource normalization |
Performance ratio, PR | Y_f / Y_r | Aggregate system-loss indicator |
Availability | Time ready for operation / reporting time | Downtime control |
Self-consumption ratio | E_self / E_PV | Internal economic value |
Export share | E_export / E_PV | Grid-delivery value |
Data completeness | Valid intervals / expected intervals | Confidence in annualization |
Solar fraction | Useful solar heat | Nominal gas equivalent | Interpretation |
|---|---|---|---|
50% | 3.39 MWh/year | ≈361 m3/year | Conservative solar contribution |
65% | 4.41 MWh/year | ≈469 m3/year | Moderate solar contribution |
75% | 5.09 MWh/year | ≈542 m3/year | Source-manuscript scenario |
85% | 5.77 MWh/year | ≈614 m3/year | High solar contribution |
Flow | Measurement point | Unit | M&V role |
|---|---|---|---|
PV AC generation | Inverter and verification meter | kWh | Technology output |
Grid import/export | Bidirectional revenue meter | kWh | Facility net electricity balance |
Delivered solar heat | Heat meter: volume flow × temperature difference | kWh_th | Useful thermal output |
Backup heat | Gas or electricity meter | m3 or kWh | Displaced conventional energy |
Hot-water demand | Flow and inlet/outlet temperature sensors | L and°C | Demand normalization |
Stage | PV task | Solar-thermal task | Outcome |
|---|---|---|---|
1 | Reconcile inverter and revenue-meter records | Log hot-water flow and temperature for 2-4 weeks | Reliable baseline |
2 | Add irradiation, PR, availability, and completeness monitoring | Complete collector sizing and hydraulic design | Design evidence |
3 | Implement O&M analytics and alarm tracking | Pilot, commission, and install heat metering | Measured performance |
4 | Conduct annual normalized M&V | Conduct annual normalized M&V | Portfolio optimization |
| Weight of the Component Before Testing (g) |
| Weight of the Component After Testing (g) |
| Mass Loss (g) |
| [1] | International Organization for Standardization. (2018). ISO 50001: 2018, Energy management systems—Requirements with guidance for use. Geneva, Switzerland: ISO. |
| [2] | International Organization for Standardization. (2023). ISO 50006: 2023, Energy management systems—Evaluating energy performance using energy performance indicators and energy baselines. Geneva, Switzerland: ISO. |
| [3] | International Organization for Standardization. (2014). ISO 50015: 2014, Energy management systems—Measurement and verification of energy performance of organizations—General principles and guidance. Geneva, Switzerland: ISO. |
| [4] | International Electrotechnical Commission. (2021). IEC 61724-1: 2021, Photovoltaic system performance—Part 1: Monitoring. Geneva, Switzerland: IEC. |
| [5] | International Electrotechnical Commission. (2016). IEC 62446-1: 2016, Photovoltaic systems—Requirements for testing, documentation and maintenance—Part 1: Grid connected systems. Geneva, Switzerland: IEC. |
| [6] | International Electrotechnical Commission. (2021). IEC 61215-1: 2021, Terrestrial photovoltaic modules—Design qualification and type approval—Part 1: Test requirements. Geneva, Switzerland: IEC. |
| [7] | International Electrotechnical Commission. (2010). IEC 62109-1: 2010, Safety of power converters for use in photovoltaic power systems—Part 1: General requirements. Geneva, Switzerland: IEC. |
| [8] | Efficiency Valuation Organization. (2022). International Performance Measurement and Verification Protocol: Core concepts. Washington, DC: EVO. |
| [9] | ASHRAE. (2014). ASHRAE Guideline 14-2014: Measurement of energy, demand, and water savings. Atlanta, GA: ASHRAE. |
| [10] | National Renewable Energy Laboratory. (2018). Best practices for operation and maintenance of photovoltaic and energy storage systems (3rd ed., NREL/TP-7A40-73822). Golden, CO: NREL. |
| [11] | Marion, B., Adelstein, J., Boyle, K., Hayden, H., Hammond, B., Fletcher, T., et al. (2005). Performance parameters for grid-connected PV systems. In Proceedings of the 31st IEEE Photovoltaic Specialists Conference (pp. 1601-1606). |
| [12] | Skoplaki, E., & Palyvos, J. A. (2009). On the temperature dependence of photovoltaic module electrical performance: A review of efficiency/power correlations. Solar Energy, 83(5), 614-624. |
| [13] | Reich, N. H., Mueller, B., Armbruster, A., van Sark, W. G. J. H. M., Kiefer, K., & Reise, C. (2012). Performance ratio revisited: Is PR > 90% realistic? Progress in Photovoltaics: Research and Applications, 20(6), 717-726. |
| [14] | Jordan, D. C., & Kurtz, S. R. (2013). Photovoltaic degradation rates—An analytical review. Progress in Photovoltaics: Research and Applications, 21(1), 12-29. |
| [15] | Firth, S. K., Lomas, K. J., & Rees, S. J. (2010). A simple model of PV system performance and its use in fault detection. Solar Energy, 84(4), 624-635. |
| [16] | Aghaei, M. (2022). Autonomous monitoring and analysis of photovoltaic systems. Energies, 15(14), 5011. |
| [17] | Duffie, J. A., & Beckman, W. A. (2013). Solar engineering of thermal processes (4th ed.). Hoboken, NJ: Wiley. |
| [18] | Kalogirou, S. A. (2004). Solar thermal collectors and applications. Progress in Energy and Combustion Science, 30(3), 231-295. |
| [19] | Shukla, R., Sumathy, K., Erickson, P., & Gong, J. (2013). Recent advances in the solar water heating systems: A review. Renewable and Sustainable Energy Reviews, 19, 173-190. |
| [20] | Tian, Y., & Zhao, C. Y. (2013). A review of solar collectors and thermal energy storage in solar thermal applications. Applied Energy, 104, 538-553. |
| [21] | Hernandez, P., & Kenny, P. (2012). Net energy analysis of domestic solar water heating installations in operation. Renewable and Sustainable Energy Reviews, 16(1), 170-177. |
| [22] | Eze, F. C., Egbo, M., Anuta, U. J., Ntiriwaa, O.-B. R., Ogola, J., & Mwabora, J. (2024). A review on solar water heating technology: Impacts of parameters and techno-economic studies. Bulletin of the National Research Centre, 48, 29. |
| [23] | Veeraboina, P., & Ratnam, G. Y. (2012). Analysis of the opportunities and challenges of solar water heating system in India: Estimates from energy audit surveys and review. Renewable and Sustainable Energy Reviews, 16(1), 668-676. |
| [24] | International Organization for Standardization. (1995). ISO 9459-2:1995, Solar heating—Domestic water heating systems—Part 2: Outdoor test methods for system performance characterization. Geneva, Switzerland: ISO. |
APA Style
A, B. A., A, S. X., A, A. J. (2026). Integration of a Photovoltaic Power System and a Solar Water Heater at an Industrial Facility: Data Reconciliation, Hybrid Energy Balance, and Measurement and Verification Methodology. American Journal of Mechanics and Applications, 13(4), 64-71. https://doi.org/10.11648/j.ajma.20261304.12
ACS Style
A, B. A.; A, S. X.; A, A. J. Integration of a Photovoltaic Power System and a Solar Water Heater at an Industrial Facility: Data Reconciliation, Hybrid Energy Balance, and Measurement and Verification Methodology. Am. J. Mech. Appl. 2026, 13(4), 64-71. doi: 10.11648/j.ajma.20261304.12
@article{10.11648/j.ajma.20261304.12,
  author = {Badalov A. A and Suyunova X. A and Abdushaxarov J. A},
  title = {Integration of a Photovoltaic Power System and a Solar Water Heater at an Industrial Facility: Data Reconciliation, Hybrid Energy Balance, and Measurement and Verification Methodology},
  journal = {American Journal of Mechanics and Applications},
  volume = {13},
  number = {4},
  pages = {64-71},
  doi = {10.11648/j.ajma.20261304.12},
  url = {https://doi.org/10.11648/j.ajma.20261304.12},
  eprint = {https://article.sciencepublishinggroup.com/pdf/10.11648.j.ajma.20261304.12},
  abstract = {Industrial facilities increasingly combine photovoltaic electricity and solar thermal heat, but audit reports may compare incompatible energy records or aggregate electrical and thermal savings into a single figure. This creates a risk of overstating system performance and double counting displaced energy. This study develops a data-quality-aware measurement and verification methodology for an existing 40 kW rooftop photovoltaic system and a proposed 400 L/day solar water-heating system at an industrial confectionery facility. Audit records were classified by temporal coverage, measurement source, and alternating-current/direct-current boundary; partial-period specific yields were calculated; photovoltaic performance indicators were structured in accordance with IEC 61724-1; useful thermal demand was estimated from the water mass, specific heat capacity, and temperature rise; and a 50-85% solar-fraction sensitivity analysis was integrated with separate electricity and heat ledgers. The audit reports 52.5 MWh for July-December 2025 and 36.2 MWh for January-April 2026, corresponding to partial-period specific yields of 1,312.5 and 905 kWh/kWp. These values cannot be compared directly with a separate 26.928 MWh annual forecast until meter identity, capacity boundary, period completeness, and self-consumption/export allocation are reconciled. For the 400 L load, 18.6 kWh of useful heat is required per cycle, and annual useful solar heat varies from 3.39 to 5.77 MWh over the investigated solar-fraction range. The proposed architecture prevents double counting by maintaining separate physical ledgers and integrating them only at the cost, emissions, or primary-energy layer. Data reconciliation and uncertainty disclosure are therefore prerequisites for credible technical and economic decisions.},
 year = {2026}
}
TY  - JOUR
T1  - Integration of a Photovoltaic Power System and a Solar Water Heater at an Industrial Facility: Data Reconciliation, Hybrid Energy Balance, and Measurement and Verification Methodology
AU  - Badalov A. A
AU  - Suyunova X. A
AU  - Abdushaxarov J. A
Y1  - 2026/10/14
PY  - 2026
N1  - https://doi.org/10.11648/j.ajma.20261304.12
DO  - 10.11648/j.ajma.20261304.12
T2  - American Journal of Mechanics and Applications
JF  - American Journal of Mechanics and Applications
JO  - American Journal of Mechanics and Applications
SP  - 64
EP  - 71
PB  - Science Publishing Group
SN  - 2376-6131
UR  - https://doi.org/10.11648/j.ajma.20261304.12
AB  - Industrial facilities increasingly combine photovoltaic electricity and solar thermal heat, but audit reports may compare incompatible energy records or aggregate electrical and thermal savings into a single figure. This creates a risk of overstating system performance and double counting displaced energy. This study develops a data-quality-aware measurement and verification methodology for an existing 40 kW rooftop photovoltaic system and a proposed 400 L/day solar water-heating system at an industrial confectionery facility. Audit records were classified by temporal coverage, measurement source, and alternating-current/direct-current boundary; partial-period specific yields were calculated; photovoltaic performance indicators were structured in accordance with IEC 61724-1; useful thermal demand was estimated from the water mass, specific heat capacity, and temperature rise; and a 50-85% solar-fraction sensitivity analysis was integrated with separate electricity and heat ledgers. The audit reports 52.5 MWh for July-December 2025 and 36.2 MWh for January-April 2026, corresponding to partial-period specific yields of 1,312.5 and 905 kWh/kWp. These values cannot be compared directly with a separate 26.928 MWh annual forecast until meter identity, capacity boundary, period completeness, and self-consumption/export allocation are reconciled. For the 400 L load, 18.6 kWh of useful heat is required per cycle, and annual useful solar heat varies from 3.39 to 5.77 MWh over the investigated solar-fraction range. The proposed architecture prevents double counting by maintaining separate physical ledgers and integrating them only at the cost, emissions, or primary-energy layer. Data reconciliation and uncertainty disclosure are therefore prerequisites for credible technical and economic decisions.
VL  - 13
IS  - 4
ER  -
Department of Thermodynamics and Energy Audit, Tashkent State Technical University, Tashkent, Uzbekistan
Biography: Badalov A. A is a researcher specializing in history, with a particular focus on the history of Central Asia and the Fergana Valley. His research interests include the history of medicine and healthcare, social history, and the development of public health and pharmacy in the region. His academic work focuses on the study and analysis of historical sources related to the social and medical development of Central Asia.
Research Fields: History, History of Medicine, Central Asian Studies, Social History

Department of Thermodynamics and Energy Audit, Tashkent State Technical University, Tashkent, Uzbekistan
Biography: Suyunova X. A is a researcher with academic interests in the field of history and social sciences. Her research focuses on the study of historical processes, social development, and cultural aspects of Central Asia. She is interested in conducting academic research and analyzing historical sources to contribute to a better understanding of the region’s history and society.
Research Fields: History, Central Asian Studies, Social History, Cultural History, and Historical Research Methods

Department of Thermodynamics and Energy Audit, Tashkent State Technical University, Tashkent, Uzbekistan
Biography: Abdushaxarov J. A is a researcher with academic interests in the field of history and social sciences. His research focuses on historical processes, social development, and the study of Central Asian history and culture.
Research Fields: History, Central Asian Studies, Social History, Cultural History, and Historical Research Methods


Information



 Share This Article
 Twitter
 Linked In
 Facebook



 Copy
Copy Download