1. Introduction
Alzheimer’s disease (AD) is the most common form of dementia and a major global health concern, characterized by progressive cognitive decline, memory impairment, and irreversible neurodegenerative changes in brain structure. Early and accurate diagnosis is critical for effective intervention and disease management; however, traditional diagnostic workflows based on clinical evaluation, neuropsychological testing, and manual interpretation of neuroimaging are often time-consuming, subjective, and dependent on expert availability. Magnetic resonance imaging (MRI) is widely used in AD diagnosis due to its ability to noninvasively capture structural brain alterations such as hippocampal atrophy and cortical thinning. Nevertheless, manual MRI analysis is challenged by inter-subject variability, subtle changes in early disease stages, and increasing data volume, motivating the need for automated and reliable diagnostic tools.
Deep learning methods, particularly convolutional neural networks (CNNs), have shown strong performance in MRI-based AD classification. However, most existing approaches function as black-box classifiers, providing limited spatial interpretability and often requiring substantial computational resources, especially in three-dimensional implementations. These limitations restrict their clinical applicability, particularly in resource-constrained settings. Object detection–based deep learning frameworks address these challenges by enabling simultaneous classification and spatial localization of disease-related biomarkers, thereby improving interpretability and clinical relevance. Despite their success in other medical imaging applications, such approaches remain relatively underexplored in Alzheimer’s disease research.
This study presents a lightweight deep learning framework for early Alzheimer’s disease detection using structural MRI, built upon the YOLOv11N architecture. Unlike prior studies that focus solely on classification accuracy, this work explicitly integrates model interpretability, clinical relevance, and deployment feasibility into the learning framework, addressing critical barriers to real-world adoption of machine learning in neurological healthcare.
The proposed system provides spatially localized disease evidence through attention-guided detection maps, enabling clinicians to visualize neuroanatomical regions contributing to diagnostic decisions. This design transforms the model from a black-box predictor into a clinically interpretable decision-support tool.
Furthermore, by emphasizing generalizability across heterogeneous MRI acquisitions and patient populations, this work advances machine learning from laboratory-level performance toward robust clinical translation. The proposed framework demonstrates how modern detection-based deep learning can be systematically aligned with clinical workflow requirements, advancing machine learning’s impact on health outcomes rather than merely improving benchmark performance.
Clinical Significance and Translation Potential
This study is designed with direct clinical deployment in mind. Early and reliable identification of Alzheimer’s disease enables earlier intervention, personalized care planning, and improved patient outcomes. The proposed detection-based framework supports these goals by offering not only diagnostic predictions but also visual evidence that aligns with established neurodegenerative biomarkers, enhancing clinician trust and interpretability.
The lightweight YOLOv11N architecture allows real-time inference on standard clinical hardware, making the system suitable for integration into hospital imaging pipelines and telemedicine platforms. This enables rapid screening in resource-limited settings and supports scalable population-level screening programs.
By unifying interpretability, efficiency, and diagnostic performance, this work advances machine learning from a purely computational tool into a clinically actionable healthcare technology.
2. Literature Review
Alzheimer’s disease (AD) represents a significant global health challenge, characterized by progressive cognitive decline, memory impairment, and structural brain changes, which necessitate early and accurate diagnosis for effective intervention. Traditional approaches for AD detection rely on clinical assessments, neuropsychological testing, and manual MRI analysis, which are often time-consuming, subjective, and dependent on expert availability, leading to delayed decision-making. To address these limitations, deep learning and advanced computer vision models have been increasingly applied to neuroimaging data for automated and objective AD detection Lu 2018
| [1] | Lu, Di, Karthik Popuri, Guowei Wen Ding, Ramya Balachandar, and Mirza Faisal Beg. 2018. “Multimodal and Multiscale Deep Neural Networks for the Early Diagnosis of Alzheimer’s Disease Using Structural MR and FDG-PET Images.” Scientific Reports 8(1): 1–13. https://doi.org/10.1038/s41598-018-22871-z |
[1]
, Islam 2018
| [2] | Islam, Jamil, and Yanqing Zhang. 2018. “Brain MRI Analysis for Alzheimer’s Disease Diagnosis Using an Ensemble System of Deep Convolutional Neural Networks.” Brain Informatics 5: 2. https://doi.org/10.1186/s40708-018-0080-3 |
[2]
, Ebrahimighahnavieh 2020
| [13] | Ebrahimighahnavieh, Mohammad Amin, Shanshan Luo, and Raymond Chiong. 2020. “Deep Learning to Detect Alzheimer’s Disease from Neuroimaging: A Systematic Literature Review.” Computer Methods and Programs in Biomedicine 187: 105242.
https://doi.org/10.1016/j.cmpb.2019.105242 |
[13]
, Sorour 2024
| [7] | Sorour, Samir E., Abdel-Aziz A. A. El-Mageed, Khaled M. Albarrak, et al. 2024. “Classification of Alzheimer’s Disease Using MRI Data Based on Deep Learning Techniques.” Journal of King Saud University – Computer and Information Sciences 36(2): 101940.
https://doi.org/10.1016/j.jksuci.2024.101940 |
[7]
. Early research in multimodal and multiscale deep neural networks demonstrated the utility of combining structural MR and FDG-PET imaging for enhanced classification of AD stages, highlighting the advantages of integrating multiple modalities to improve predictive accuracy Lu 2018
| [1] | Lu, Di, Karthik Popuri, Guowei Wen Ding, Ramya Balachandar, and Mirza Faisal Beg. 2018. “Multimodal and Multiscale Deep Neural Networks for the Early Diagnosis of Alzheimer’s Disease Using Structural MR and FDG-PET Images.” Scientific Reports 8(1): 1–13. https://doi.org/10.1038/s41598-018-22871-z |
[1]
, Qiu 2022
| [5] | Qiu, Shuang, Michael I. Miller, P. S. Joshi, et al. 2022. “Multimodal Deep Learning for Alzheimer’s Disease Dementia Assessment.” Nature Communications 13(1): 3404.
https://doi.org/10.1038/s41467-022-31037-5 |
[5]
, Venugopalan 2021
| [10] | Venugopalan, Janani, Ling Tong, Hamid R. Hassanzadeh, and May D. Wang. 2021. “Multimodal Deep Learning Models for Early Detection of Alzheimer’s Disease Stage.” Scientific Reports 11(1): 3254.
https://doi.org/10.1038/s41598-021-82747-3 |
[10]
. Similarly, ensemble systems of convolutional neural networks have been shown to robustly analyze brain MRI scans, outperforming single-model architectures in distinguishing Alzheimer’s Disease, Mild Cognitive Impairment, and Cognitively Normal cases Islam 2018
| [2] | Islam, Jamil, and Yanqing Zhang. 2018. “Brain MRI Analysis for Alzheimer’s Disease Diagnosis Using an Ensemble System of Deep Convolutional Neural Networks.” Brain Informatics 5: 2. https://doi.org/10.1186/s40708-018-0080-3 |
[2]
, Tanveer 2022
| [8] | Tanveer, Mohd, Abdul H. Rashid, M. A. Ganaie, et al. 2022. “Classification of Alzheimer’s Disease Using Ensemble of Deep Neural Networks Trained through Transfer Learning.” IEEE Journal of Biomedical and Health Informatics 26(5): 1453–1463.
https://doi.org/10.1109/JBHI.2021.3083270 |
[8]
, Jo 2019
| [15] | Jo, Taeho, Kwangsik Nho, and Andrew J. Saykin. 2019. “Deep Learning in Alzheimer’s Disease: Diagnostic Classification and Prognostic Prediction Using Neuroimaging Data.” Frontiers in Aging Neuroscience 11: 220.
https://doi.org/10.3389/fnagi.2019.00220 |
[15]
, Alruily 2025
| [31] | Alruily, Meshrif, A. A. Abd El-Aziz, Ayman Mohamed Mostafa, Mohamed Ezz, Elsayed Mostafa, Ahmed Alsayat, and Sameh Abd El-Ghany. 2025. “Ensemble Deep Learning for Alzheimer’s Disease Diagnosis Using MRI: Integrating Features from VGG16, MobileNet, and InceptionResNetV2 Models.” PLoS One 20(4): e0318620.
https://doi.org/10.1371/journal.pone.0318620 |
[31]
. More recently, transformer-based architectures have been explored for image recognition and medical imaging applications, with studies showing that self-attention mechanisms can capture long-range dependencies in MRI data, potentially enhancing AD stage classification Dosovitskiy 2021
, Vaswani 2017
, Zhou 2025
| [19] | Zhou, J., Y. Wei, X. Li, et al. 2025. “A Deep Learning Model for Early Diagnosis of Alzheimer’s Disease Combined with 3D CNN and Video Swin Transformer.” Scientific Reports 15: 23311. https://doi.org/10.1038/s41598-025-05568-y |
[19]
. The application of object detection models, particularly YOLO-based frameworks, has emerged as a promising direction by enabling simultaneous classification and spatial localization of disease-related biomarkers within MRI scans. Redmon 2016
| [6] | Redmon, Joseph, Santosh Divvala, Ross Girshick, and Ali Farhadi. 2016. “You Only Look Once: Unified, Real-Time Object Detection.” In Proceedings of the IEEE Conference on Computer Vision and Pattern Recognition, 779–788.
https://doi.org/10.48550/arXiv.1506.02640 |
[6]
first introduced YOLO as a unified real-time object detection framework, which inspired later works for medical imaging applications including AD detection Sekharamantry 2025
| [4] | Sekharamantry, P. K., F. Melgani, R. Delfiore, and S. Lusardi. 2025. “Enhanced YOLOv8 Framework for Early Detection of Alzheimer’s Disease Using MRI Scans.” SciTePress.
https://doi.org/10.5281/zenodo.133153 |
[4]
, Hechkel 2025
| [14] | Hechkel, Ahmed, and Mohamed Helali. 2025. “Early Detection and Classification of Alzheimer’s Disease through Data Fusion of MRI and DTI Images Using the YOLOv11 Neural Network.” Frontiers in Neuroscience 19: 1554015.
https://doi.org/10.3389/fnins.2025.1554015 |
[14]
, Bukaita 2025
| [25] | Bukaita, Wisam, Erik Hoti, and Ishaan Pathak. 2025. “Advancing Automated Brain Tumor Detection: A YOLOv11-Based Deep Learning Approach for Real-Time MRI Analysis.” Journal of Cancer Treatment and Research 13(4): 107–118.
https://doi.org/10.11648/j.jctr.20251304.13 |
[25]
, Akkidi 2025
| [27] | Akkidi, Yashwanth Reddy, and Wisam Bukaita. 2025. “Real-Time Alzheimer’s Detection Using Deep Vision Models.” Medical Research Archives 13(8): (August 2025).
https://doi.org/10.18103/mra.v13i8.6806 |
[27]
, El-Latif 2023
| [21] | El-Latif, Ahmed A. Abd, Samia Allaoua Chelloug, Maali Alabdulhafith, and Mohamed Hammad. 2023. “Accurate Detection of Alzheimer’s Disease Using Lightweight Deep Learning Model on MRI Data.” Diagnostics 13(7): 1216.
https://doi.org/10.3390/diagnostics13071216 |
[21]
, Altwijri 2023
| [17] | Altwijri, Omar, Reem Alanazi, Adham Aleid, Khalid Alhussaini, Ziyad Aloqalaa, Mohammed Almijalli, and Ali Saad. 2023. “Novel Deep-Learning Approach for Automatic Diagnosis of Alzheimer’s Disease from MRI.” Applied Sciences 13(24): 13051. https://doi.org/10.3390/app132413051 |
[17]
. Lightweight detection models have also gained attention for their computational efficiency and deployment potential in clinical settings. Wen 2022
| [11] | Wen, Jing, Elise Thibeau-Sutre, Manuel Diaz-Melo, et al. 2022. “Generalizable Deep Learning Model for Early Alzheimer’s Disease Detection from Structural MRIs.” Scientific Reports 12(1): 1687.
https://doi.org/10.1038/s41598-022-20674-x |
[11]
demonstrated that optimized CNN architectures can generalize well across datasets while maintaining interpretability, whereas El-Latif 2023
| [21] | El-Latif, Ahmed A. Abd, Samia Allaoua Chelloug, Maali Alabdulhafith, and Mohamed Hammad. 2023. “Accurate Detection of Alzheimer’s Disease Using Lightweight Deep Learning Model on MRI Data.” Diagnostics 13(7): 1216.
https://doi.org/10.3390/diagnostics13071216 |
[21]
reported accurate AD detection using compact deep learning models on MRI data. Ensemble and hybrid learning methods further enhance performance by integrating features from multiple CNN architectures, as shown by Tanveer 2022
| [8] | Tanveer, Mohd, Abdul H. Rashid, M. A. Ganaie, et al. 2022. “Classification of Alzheimer’s Disease Using Ensemble of Deep Neural Networks Trained through Transfer Learning.” IEEE Journal of Biomedical and Health Informatics 26(5): 1453–1463.
https://doi.org/10.1109/JBHI.2021.3083270 |
[8]
, Alruily 2025
| [31] | Alruily, Meshrif, A. A. Abd El-Aziz, Ayman Mohamed Mostafa, Mohamed Ezz, Elsayed Mostafa, Ahmed Alsayat, and Sameh Abd El-Ghany. 2025. “Ensemble Deep Learning for Alzheimer’s Disease Diagnosis Using MRI: Integrating Features from VGG16, MobileNet, and InceptionResNetV2 Models.” PLoS One 20(4): e0318620.
https://doi.org/10.1371/journal.pone.0318620 |
[31]
, Tuan
| [32] | Tuan, Tran Anh, The Bao Pham, Jin Young Kim, and João Manuel R. S. Tavares. 2022. “Alzheimer’s Diagnosis Using Deep Learning in Segmenting and Classifying 3D Brain MR Images.” The International Journal of Neuroscience 132(7): 689–698.
https://doi.org/10.1080/00207454.2021.1978382 |
[32]
, and Zolfaghari 2025
| [29] | Zolfaghari, Sepideh, Atra Joudaki, and Yashar Sarbaz. 2025. “A Hybrid Learning Approach for MRI-Based Detection of Alzheimer’s Disease Stages Using Dual CNNs and Ensemble Classifier.” Scientific Reports 15: 25342.
https://doi.org/10.1038/s41598-025-11743-y |
[29]
. The role of multimodal data, including non-imaging biomarkers, has been increasingly emphasized in AD detection studies. Anyaiwe 2023
| [12] | Anyaiwe, Oriehi Destiny, and Wisam Bukaita. 2023. “Identifying Candidate Biomarkers for Alzheimer’s Disease Diagnoses Using Saliva ¹H NMR-Based Metabolomics.” In Proceedings of the Future Technologies Conference, edited by Kohei Arai, 585–593. Lecture Notes in Networks and Systems 815. Cham: Springer.
https://doi.org/10.1007/978-3-031-47457-6_39 |
[12]
explored the use of saliva ¹H NMR-based metabolomics to identify candidate biomarkers, highlighting the potential for combining imaging and molecular data for improved diagnostic accuracy. Multimodal deep learning approaches integrating structural MRI, diffusion tensor imaging, and functional imaging have been reported to improve early-stage detection and prognostic prediction Qiu 2022
| [5] | Qiu, Shuang, Michael I. Miller, P. S. Joshi, et al. 2022. “Multimodal Deep Learning for Alzheimer’s Disease Dementia Assessment.” Nature Communications 13(1): 3404.
https://doi.org/10.1038/s41467-022-31037-5 |
[5]
, Venugopalan 2021
| [10] | Venugopalan, Janani, Ling Tong, Hamid R. Hassanzadeh, and May D. Wang. 2021. “Multimodal Deep Learning Models for Early Detection of Alzheimer’s Disease Stage.” Scientific Reports 11(1): 3254.
https://doi.org/10.1038/s41598-021-82747-3 |
[10]
, Hechkel 2025
| [14] | Hechkel, Ahmed, and Mohamed Helali. 2025. “Early Detection and Classification of Alzheimer’s Disease through Data Fusion of MRI and DTI Images Using the YOLOv11 Neural Network.” Frontiers in Neuroscience 19: 1554015.
https://doi.org/10.3389/fnins.2025.1554015 |
[14]
, Altwijri 2023
| [17] | Altwijri, Omar, Reem Alanazi, Adham Aleid, Khalid Alhussaini, Ziyad Aloqalaa, Mohammed Almijalli, and Ali Saad. 2023. “Novel Deep-Learning Approach for Automatic Diagnosis of Alzheimer’s Disease from MRI.” Applied Sciences 13(24): 13051. https://doi.org/10.3390/app132413051 |
[17]
, Alasiry 2025
| [18] | Alasiry, A., Shinan K., Alsadhan A. A., et al. 2025. “A Novel Neuroimaging Based Early Detection Framework for Alzheimer Disease Using Deep Learning.” Scientific Reports 15: 23011. https://doi.org/10.1038/s41598-025-05529-5 |
[18]
, Lee 2022
| [16] | Lee, Chi-Sang, David Wang, Ricardo Henao, et al. 2022. “A Deep Learning Model for Detection of Alzheimer’s Disease Based on Retinal Photographs: A Retrospective, Multicentre Case-Control Study.” The Lancet Digital Health 4(9): e648–e657. https://doi.org/10.1016/S2589-7500(22)00169-8 |
[16]
. Recent studies have leveraged large-scale datasets and extensive MRI repositories to train deep learning models capable of handling substantial inter-patient variability and subtle structural changes. Mousavi 2025
| [28] | Mousavi, Seyed Mohammad, Khadijeh Moulaei, and Leila Ahmadian. 2025. “Classifying and Diagnosing Alzheimer’s Disease with Deep Learning Using 6,735 Brain MRI Images.” Scientific Reports 15: 22721.
https://doi.org/10.1038/s41598-025-08092-1 |
[28]
applied deep learning on 6,735 brain MRI images to classify and diagnose AD stages, while Bae 2024
| [33] | Bae, J. B., S. Lee, W. Jung, S. Park, W. Kim, H. Oh, et al. 2024. “Identification of Alzheimer’s Disease Using a Convolutional Neural Network Model Based on T1-Weighted Magnetic Resonance Imaging.” Scientific Reports 14: 3463.
https://doi.org/10.1038/s41598-024-53733-6 |
[33]
focused on T1-weighted MRIs using CNNs for accurate disease identification. Advanced architectures combining CNNs with transformer modules, as explored by Zhou 2025
| [19] | Zhou, J., Y. Wei, X. Li, et al. 2025. “A Deep Learning Model for Early Diagnosis of Alzheimer’s Disease Combined with 3D CNN and Video Swin Transformer.” Scientific Reports 15: 23311. https://doi.org/10.1038/s41598-025-05568-y |
[19]
, have further demonstrated improved accuracy in detecting early AD manifestations. Reviews and meta-analyses have highlighted trends, challenges, and emerging best practices in AD detection using machine learning and deep learning approaches, emphasizing the importance of robust datasets, multimodal integration, and generalizable architectures Shen 2025
, Khan 2024
.
The literature also emphasizes the comparative evaluation of model variants, balancing accuracy, computational cost, and interpretability. Sekharamantry 2025
| [4] | Sekharamantry, P. K., F. Melgani, R. Delfiore, and S. Lusardi. 2025. “Enhanced YOLOv8 Framework for Early Detection of Alzheimer’s Disease Using MRI Scans.” SciTePress.
https://doi.org/10.5281/zenodo.133153 |
[4]
evaluated a YOLOv8 framework for MRI-based AD detection, highlighting efficiency gains of lightweight models over larger baseline networks. Similarly, Altwijri 2023
| [17] | Altwijri, Omar, Reem Alanazi, Adham Aleid, Khalid Alhussaini, Ziyad Aloqalaa, Mohammed Almijalli, and Ali Saad. 2023. “Novel Deep-Learning Approach for Automatic Diagnosis of Alzheimer’s Disease from MRI.” Applied Sciences 13(24): 13051. https://doi.org/10.3390/app132413051 |
[17]
and Small 2022
| [20] | Small, Scott A., et al. 2022. “A Deep Learning MRI Approach Outperforms Other Biomarkers of Prodromal Alzheimer’s Disease.” Alzheimer’s Research & Therapy 14(1): 45.
https://doi.org/10.1186/s13195-022-00985-x |
[20]
compared different deep learning models and confirmed that optimized architectures can outperform traditional biomarkers in early detection of prodromal AD. Hybrid learning approaches combining dual CNNs and ensemble classifiers have been reported to enhance stage-specific classification of AD, addressing class imbalance and improving robustness Zolfaghari 2025
| [29] | Zolfaghari, Sepideh, Atra Joudaki, and Yashar Sarbaz. 2025. “A Hybrid Learning Approach for MRI-Based Detection of Alzheimer’s Disease Stages Using Dual CNNs and Ensemble Classifier.” Scientific Reports 15: 25342.
https://doi.org/10.1038/s41598-025-11743-y |
[29]
, Alruily 2025
| [31] | Alruily, Meshrif, A. A. Abd El-Aziz, Ayman Mohamed Mostafa, Mohamed Ezz, Elsayed Mostafa, Ahmed Alsayat, and Sameh Abd El-Ghany. 2025. “Ensemble Deep Learning for Alzheimer’s Disease Diagnosis Using MRI: Integrating Features from VGG16, MobileNet, and InceptionResNetV2 Models.” PLoS One 20(4): e0318620.
https://doi.org/10.1371/journal.pone.0318620 |
[31]
. Furthermore, studies by Patel 2025
, Garcia de Celis 2025
| [26] | Garcia de Celis, Guillermo, and Wisam Bukaita. 2025. “Deep Learning-Based Lumbar Spinal Canal Stenosis Classification Using MRI Scans.” Medical Research Archives 13(7).
https://doi.org/10.18103/mra.v13i7.6660. |
[26]
, and Bukaita 2025
| [25] | Bukaita, Wisam, Erik Hoti, and Ishaan Pathak. 2025. “Advancing Automated Brain Tumor Detection: A YOLOv11-Based Deep Learning Approach for Real-Time MRI Analysis.” Journal of Cancer Treatment and Research 13(4): 107–118.
https://doi.org/10.11648/j.jctr.20251304.13 |
[25]
extend the application of YOLO-based object detection models to neurological and medical imaging contexts, demonstrating the feasibility of real-time detection and spatial localization of brain abnormalities. Akkidi 2025
| [27] | Akkidi, Yashwanth Reddy, and Wisam Bukaita. 2025. “Real-Time Alzheimer’s Detection Using Deep Vision Models.” Medical Research Archives 13(8): (August 2025).
https://doi.org/10.18103/mra.v13i8.6806 |
[27]
specifically applied deep vision models for real-time AD detection, reinforcing the potential of object detection frameworks to provide both diagnostic classification and anatomical interpretability. Vadde 2025
| [30] | Vadde, Vinod, and Wisam Bukaita. 2025. “Comparative Evaluation of CNN and ResNet18 Architectures for MRI?Based Brain Tumor Classification Using Deep Learning.” Medical Research Archives 13 (12). https://doi.org/10.18103/mra.v13i12.7100 |
[30]
further validated deep learning frameworks for early AD diagnosis, demonstrating scalability across MRI datasets and robustness in multi-center studies. The evolution of deep learning methods for Alzheimer’s disease detection illustrates a clear shift from traditional classification-focused approaches toward multimodal, interpretable, and real-time object detection frameworks. Integrating CNNs, transformers, YOLO-based models, and hybrid architectures allows for simultaneous AD stage classification and localization of structural brain abnormalities, offering scalable and clinically relevant diagnostic tools (Lu 2018
| [1] | Lu, Di, Karthik Popuri, Guowei Wen Ding, Ramya Balachandar, and Mirza Faisal Beg. 2018. “Multimodal and Multiscale Deep Neural Networks for the Early Diagnosis of Alzheimer’s Disease Using Structural MR and FDG-PET Images.” Scientific Reports 8(1): 1–13. https://doi.org/10.1038/s41598-018-22871-z |
[1]
, Islam 2018
| [2] | Islam, Jamil, and Yanqing Zhang. 2018. “Brain MRI Analysis for Alzheimer’s Disease Diagnosis Using an Ensemble System of Deep Convolutional Neural Networks.” Brain Informatics 5: 2. https://doi.org/10.1186/s40708-018-0080-3 |
[2]
, Sekharamantry 2025
| [4] | Sekharamantry, P. K., F. Melgani, R. Delfiore, and S. Lusardi. 2025. “Enhanced YOLOv8 Framework for Early Detection of Alzheimer’s Disease Using MRI Scans.” SciTePress.
https://doi.org/10.5281/zenodo.133153 |
[4]
, Hechkel 2025
| [14] | Hechkel, Ahmed, and Mohamed Helali. 2025. “Early Detection and Classification of Alzheimer’s Disease through Data Fusion of MRI and DTI Images Using the YOLOv11 Neural Network.” Frontiers in Neuroscience 19: 1554015.
https://doi.org/10.3389/fnins.2025.1554015 |
[14]
, Bukaita 2025
| [25] | Bukaita, Wisam, Erik Hoti, and Ishaan Pathak. 2025. “Advancing Automated Brain Tumor Detection: A YOLOv11-Based Deep Learning Approach for Real-Time MRI Analysis.” Journal of Cancer Treatment and Research 13(4): 107–118.
https://doi.org/10.11648/j.jctr.20251304.13 |
[25]
, Akkidi 2025
| [27] | Akkidi, Yashwanth Reddy, and Wisam Bukaita. 2025. “Real-Time Alzheimer’s Detection Using Deep Vision Models.” Medical Research Archives 13(8): (August 2025).
https://doi.org/10.18103/mra.v13i8.6806 |
[27]
; Mousavi 2025
| [28] | Mousavi, Seyed Mohammad, Khadijeh Moulaei, and Leila Ahmadian. 2025. “Classifying and Diagnosing Alzheimer’s Disease with Deep Learning Using 6,735 Brain MRI Images.” Scientific Reports 15: 22721.
https://doi.org/10.1038/s41598-025-08092-1 |
[28]
, Zolfaghari 2025
| [29] | Zolfaghari, Sepideh, Atra Joudaki, and Yashar Sarbaz. 2025. “A Hybrid Learning Approach for MRI-Based Detection of Alzheimer’s Disease Stages Using Dual CNNs and Ensemble Classifier.” Scientific Reports 15: 25342.
https://doi.org/10.1038/s41598-025-11743-y |
[29]
, Bae 2024
| [33] | Bae, J. B., S. Lee, W. Jung, S. Park, W. Kim, H. Oh, et al. 2024. “Identification of Alzheimer’s Disease Using a Convolutional Neural Network Model Based on T1-Weighted Magnetic Resonance Imaging.” Scientific Reports 14: 3463.
https://doi.org/10.1038/s41598-024-53733-6 |
[33]
, Sorour 2024
| [7] | Sorour, Samir E., Abdel-Aziz A. A. El-Mageed, Khaled M. Albarrak, et al. 2024. “Classification of Alzheimer’s Disease Using MRI Data Based on Deep Learning Techniques.” Journal of King Saud University – Computer and Information Sciences 36(2): 101940.
https://doi.org/10.1016/j.jksuci.2024.101940 |
[7]
, Lee 2022
| [16] | Lee, Chi-Sang, David Wang, Ricardo Henao, et al. 2022. “A Deep Learning Model for Detection of Alzheimer’s Disease Based on Retinal Photographs: A Retrospective, Multicentre Case-Control Study.” The Lancet Digital Health 4(9): e648–e657. https://doi.org/10.1016/S2589-7500(22)00169-8 |
[16]
, Shen 2025
, Khan 2024
, Bolla 2025
, Vadde 2025
| [30] | Vadde, Vinod, and Wisam Bukaita. 2025. “Comparative Evaluation of CNN and ResNet18 Architectures for MRI?Based Brain Tumor Classification Using Deep Learning.” Medical Research Archives 13 (12). https://doi.org/10.18103/mra.v13i12.7100 |
[30]
. The reviewed literature collectively supports the feasibility and benefits of automated detection and spatial localization of AD stages using deep learning-based object detection on MRI data.
Despite the significant advancements in automated classification and the preliminary application of object detection models like YOLO for brain abnormalities, a critical gap remains in the granularity and clinical explainability of spatial localization across the full spectrum of AD progression. While current models can identify and classify AD stages, most research treats the brain as a "black box" or focuses on broad structural changes. There is a lack of integrated frameworks that can simultaneously localize specific, stage-dependent anatomical biomarkers (such as localized hippocampal atrophy or ventricular enlargement) while maintaining the real-time processing speeds necessary for clinical workflow integration. Furthermore, many existing object detection applications in AD have not been sufficiently validated for their ability to pinpoint exactly where the structural indicators of early-stage MCI transition into AD, leaving a void in tools that provide both a high-confidence diagnosis and a precise visual map of pathology for surgical or therapeutic targeting.
3. Research Methodology
This study proposes an automated framework for the detection and spatial localization of Alzheimer’s disease (AD) stages from structural magnetic resonance imaging (MRI) using the YOLOv11 deep learning architecture. Although the initial experimental design referenced the YOLOv11S model, training logs confirmed that all experiments were conducted using YOLOv11N, the lightweight “Nano” variant of the YOLOv11 family. Both models share an identical architectural design; however, YOLOv11N contains substantially fewer parameters, approximately 1–3 million, compared to 7–10 million parameters in YOLOv11S. This reduced complexity enables faster training, lower memory consumption, and efficient inference in resource-constrained environments. Despite its compact size, YOLOv11N demonstrated strong detection performance in this study, achieving competitive precision, recall, and mean Average Precision (mAP) scores.
3.1. Rationale for YOLOv11-based Object Detection
YOLOv11 was selected due to its ability to perform simultaneous classification and localization within a single unified framework. Unlike traditional classification-only approaches, YOLO-based models provide spatial interpretability by identifying brain regions associated with pathological changes, which enhances clinical relevance. YOLOv11 incorporates anchor-free detection heads and an optimized backbone architecture, offering improved localization accuracy and reduced computational overhead compared to earlier anchor-based detectors such as Faster R-CNN. These characteristics make YOLOv11 well suited for medical imaging applications that require efficiency, scalability, and interpretability.
3.2. Selection of YOLOv11N over YOLOv11S
Although YOLOv11S typically offers marginally higher representational capacity, this study adopted YOLOv11N to achieve an optimal balance between detection accuracy and computational efficiency. YOLOv11N enables rapid training and real-time inference while maintaining reliable spatial localization of disease-related biomarkers. Experimental results demonstrated that YOLOv11N achieved superior mAP@0.5 performance and more balanced precision–recall behavior compared to YOLOv11S under identical training conditions. Consequently, YOLOv11N was identified as the most suitable model for scalable and resource-efficient Alzheimer’s disease detection.
3.3. Technologies and Implementation Environment
The proposed framework was implemented in Python using the Ultralytics YOLOv11 library, with PyTorch serving as the underlying deep learning engine. OpenCV was employed for image preprocessing, while NumPy supported numerical operations. Model training and inference were accelerated using an NVIDIA GPU. The Ultralytics training pipeline was utilized to manage data augmentation, optimization, and performance monitoring.
3.4. Dataset Description
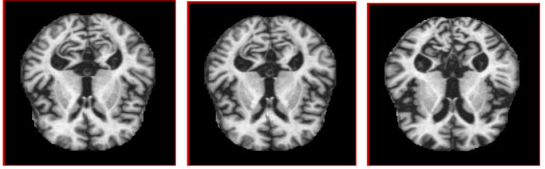
The experimental evaluation was conducted using a high-quality dataset sourced from the Alzheimer’s Disease Neuroimaging Initiative (ADNI) comprising clinically diagnosed Alzheimer’s disease (AD) patients, individuals with Mild Cognitive Impairment (MCI), and Cognitively Normal (CN) controls. The dataset includes 1,323 T1-weighted structural MRI scans, with representative samples for each diagnostic class illustrated in
Figures 1, 2, and 3. All data were acquired through multicenter longitudinal studies and annotated by clinical experts according to standardized criteria, ensuring high-quality labeling and reproducibility.
This dataset incorporates heterogeneous imaging conditions including diverse scanner types, acquisition protocols, and patient demographics to support the evaluation of model generalizability across real-world clinical environments. To ensure robust performance, the data were partitioned into training, validation, and test subsets using stratified splitting to maintain consistent class distributions. To mitigate the impact of class imbalance, particularly the underrepresentation of AD and MCI cases, extensive data augmentation techniques were applied during the training phase. These transformations increased data diversity and enhanced the model's ability to generalize, ensuring readiness for deployment where clinical data distributions typically deviate from controlled research benchmarks.
Figure 1. Alzheimer’s Disease (AD) MRI Scan.
Figure 1 illustrates a T1-weighted MRI scan from a patient diagnosed with Alzheimer’s Disease, characterized by notable hippocampal and cortical atrophy.
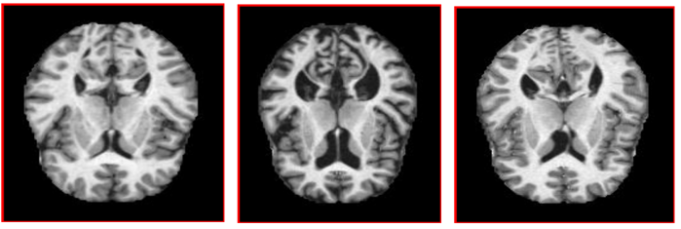
Figure 2. Mild Cognitive Impairment (MCI) MRI Scan.
Figure 2 presents an MRI scan from a patient with Mild Cognitive Impairment, revealing subtle volumetric reductions in the medial temporal lobe indicative of early-stage cognitive decline.
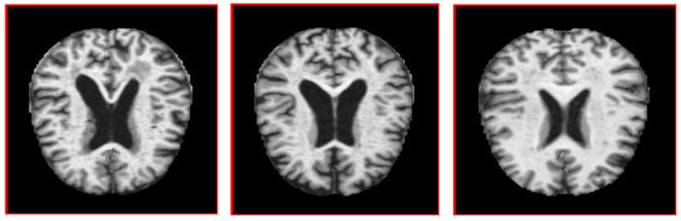
Figure 3. Cognitive Normal (CN) MRI Scan.
Figure 3 shows an MRI scan of a cognitively normal individual, displaying preserved brain structure with no evident signs of pathological atrophy. The distribution of MRI scans across the training, validation, and test subsets for each diagnostic category Alzheimer’s Disease (AD), Mild Cognitive Impairment (MCI), and Cognitively Normal (CN) is summarized in
Table 1.
Table 1. Class Distribution of MRI Scans in Training and Test Sets.
Images | Total Images | AD | MCI | CN |
Train | 5121 | 179 | 2835 | 603 |
Test | 688 | 29 | 46 | 98 |
Total Annotations | - | 208 | 2881 | 2205 |
3.5. Data Preprocessing and Augmentation
All MRI images were resized to 320 × 320 pixels to satisfy YOLO input requirements and normalized to standardize intensity distributions. Labels were converted to YOLO format, consisting of class identifiers and normalized bounding box coordinates representing regions of pathological relevance.
To mitigate class imbalance and improve generalization, multiple augmentation techniques were employed, including mosaic augmentation, random horizontal flipping, HSV-based intensity perturbations, rotation, scaling, translation, and random erasing. These transformations increased data diversity and enhanced the model’s robustness to anatomical variability and acquisition differences across MRI scans.
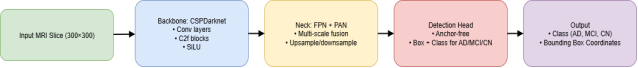
3.6. Model Architecture
YOLOv11N follows a modular architecture comprising a backbone, neck, and detection head. The backbone, based on a Cross Stage Partial (CSP) design, extracts hierarchical spatial features from MRI images. The neck integrates Feature Pyramid Network (FPN) and Path Aggregation Network (PANet) components to fuse multi-scale features, enabling the detection of both subtle and pronounced neurodegenerative patterns.
The anchor-free detection head predicts bounding boxes and class probabilities directly from feature maps, improving localization precision while reducing computational complexity. The model presented in
Figure 4 is configured to detect three classes: AD, MCI, and CN.
Figure 4. YOLOvllN – Based Architecture for Alzheimer’s Disease Detection in MRI Scans.
3.7. Training Procedure and Evaluation Metrics
The model training phase is structured within the Ultralytics YOLO framework, employing a systematic protocol designed to ensure the stability and reproducibility of the diagnostic outcomes. Both the YOLOv11S and YOLOv11N architectures will be trained over a duration of 200 epochs utilizing a batch size of 16. To preserve the fine-grained morphological details essential for the spatial localization of neuroanatomical biomarkers, all input MRI data will be standardized to a resolution of 640 × 640 pixels. Optimization will be governed by a multi-component composite loss function that integrates bounding box regression, objectness, and classification losses, thereby enabling the simultaneous refinement of coordinate accuracy and stage-specific categorization.
To ensure a rigorous comparative analysis, identical training configurations and data augmentation strategies such as spatial transformations and pixel-level adjustments will be applied across both model variants, YOLOv11S and YOLOv11N. This uniformity is critical to isolating the performance differences attributable to the architectural depth and complexity of the S and N variants. The models' predictive performance will be rigorously quantified using a suite of standard metrics, including precision, recall, and mean Average Precision at a 0.5 Intersection over Union (mAP@0.5). Furthermore, the diagnostic robustness of each model will be scrutinized through confusion matrix analysis, which serves to characterize class-wise prediction behavior and identify specific areas of categorical overlap between Alzheimer’s Disease (AD), Mild Cognitive Impairment (MCI), and Cognitively Normal (CN) cohorts.
3.8. Research Design
This study adopts an experimental, quantitative research design aimed at developing and validating an automated deep learning framework for Alzheimer’s disease detection from MRI data. The workflow includes data acquisition, preprocessing, model training, validation, and independent testing. Evaluation was performed using standardized object detection metrics and diagnostic analyses, including loss curve inspection and confusion matrix evaluation. Emphasis was placed on both predictive performance and clinical applicability, with particular attention to computational efficiency and interpretability to support future real-world deployment.
4. Results
The proposed deep learning framework for automated Alzheimer’s disease detection and spatial localization from MRI data begins with a description of the finalized model configuration and training setup, followed by quantitative performance assessment using standard object detection metrics. Comparative results between YOLOv11 variants are then reported to justify model selection. Further analyses include confusion matrix evaluation, training convergence behavior, class-wise performance assessment, and comparison with existing deep learning approaches in the literature. Together, these results provide a rigorous and transparent assessment of the model’s accuracy, robustness, and clinical applicability.
4.1. Model Configuration and Training Setup
The experimental phase of this study utilized the YOLOv11N (Nano) architecture. Although the YOLOv11S (Small) variant was initially considered, the Nano configuration was selected for its optimal balance of computational efficiency and predictive accuracy. Comprising approximately 2.6 million parameters, YOLOv11N facilitates high-speed inference and reduced training latency, which is critical for processing high-dimensional neuroimaging data.
The primary model checkpoint was established at epoch 90, identified as the point of peak mean Average Precision (mAP) on the validation cohort. To ensure architectural compatibility with the network's 32-pixel maximum stride, all MRI scans originally captured at a native resolution of 640 × 640 pixels were down sampled to 320 × 320 pixels.
To address the inherent class imbalance within the ADNI dataset where Cognitively Normal (CN) samples disproportionately outnumber Alzheimer’s Disease (AD) and Mild Cognitive Impairment (MCI) instances a robust data augmentation pipeline was implemented. These techniques were designed to enhance the model's generalization capabilities and mitigate overfitting by artificially expanding the minority class distributions. The augmentation suite included:
1) Spatial Transformations: 50% probability horizontal flipping and geometric scaling/translations to simulate variability in patient positioning.
2) Mosaic Augmentation: The integration of four distinct images into a single training sample, encouraging the model to identify features across varying contexts and scales.
3) Intensity & Color Perturbations: HSV (Hue, Saturation, Value) adjustments to ensure robustness against signal intensity variations common in MRI acquisition.
4) Regularization Techniques: Rand Augment and random erasing were applied to simulate partial occlusions and enforce feature invariance.
Standardized preprocessing involved normalizing pixel intensities to a [0, 1] range to accelerate gradient convergence. Annotations were converted into the YOLO-specific format, defining class indices and normalized bounding box coordinates for the targeted regions of interest.
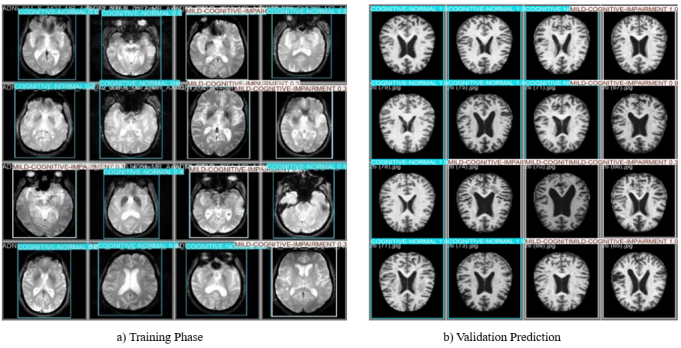
Figure 5 illustrates the conceptual and functional distinction between the training phase and the validation prediction phase in the YOLOv11 framework, demonstrating how the model transitions from learning image representations to applying this knowledge to previously unseen data.
During training, the model is exposed to annotated MRI data in which the ground-truth bounding boxes, provided by clinical experts, represent the correct diagnostic regions. These training samples are commonly visualized as multi-image mosaics arranged in 4×4 or 8×8 grids. This mosaic augmentation strategy combines multiple MRI slices into a single composite input, enabling the network to learn contextual relationships across different spatial scales and improving robustness to variations in scan resolution and quality. Two-dimensional (2D) MRI slices were selected instead of full three-dimensional (3D) volumes primarily to balance model performance, computational efficiency, and clinical deployability. Object detection architectures such as YOLO are natively designed for 2D image analysis and have demonstrated strong performance in medical imaging tasks where localized structural abnormalities are present. Using 2D slices significantly reduces memory requirements, training time, and hardware constraints compared to 3D convolutional models, which typically require high-end GPUs and large annotated volumetric datasets. Additionally, slice-based processing enables effective data augmentation and increases the number of training samples derived from limited 3D scans, helping to mitigate class imbalance commonly observed in Alzheimer’s disease datasets.
Figure 5. Training and Validation Visualization of YOLOv11N Model Performance on Brain MRI Data.
The training images in
Figure 6 display bounding boxes corresponding to the target diagnostic classes, which serve as reference outputs for computing the loss function. Through iterative backpropagation, the model adjusts its internal parameters to minimize discrepancies between predicted and ground-truth annotations. The visible geometric shifts, intensity variations, and slight distortions in these training examples reflect the application of data augmentation techniques, including HSV modifications, scaling, and horizontal flipping, which are deliberately introduced to enhance generalization under real clinical conditions.
In contrast, the validation predictions shown in
Figure 6 represent the inference stage, where the trained network processes MRI scans that were not included during weight optimization. The resulting grid of brain images with colored bounding boxes demonstrates the model’s ability to perform simultaneous localization and classification, identifying Cognitively Normal (CN), Mild Cognitive Impairment (MCI), and Alzheimer’s Disease (AD) patterns in a single forward pass.
The colored bounding boxes define the Regions of Interest (ROI) automatically detected by the model, highlighting neuroanatomical structures relevant to cognitive impairment. The accompanying decimal values correspond to confidence scores, which quantify the model’s estimated probability that the identified pathology is present within each predicted region.
Successful validation predictions provide direct evidence of the model’s capacity to generalize beyond the training dataset, confirming that performance gains arise from learned diagnostic patterns rather than memorization of training samples. While training visualizations capture the dynamic optimization process, validation predictions constitute static but critical indicators of clinical readiness and real-world applicability.
4.2. Overall Detection Performance
The quantitative performance of YOLOv11N is summarized in
Table 2. The model achieved a precision of 0.7315, a recall of 0.7378, and a mean Average Precision (mAP@0.5) of 0.8145. Notably, the mAP@0.5–0.95 value was also 0.8145, indicating stable localization accuracy across varying Intersection-over-Union thresholds.
These results demonstrate that YOLOv11N provides a balanced trade-off between sensitivity and specificity while maintaining consistent spatial localization performance.
Table 2. Performance Metrics of YOLOv11N Model.
Metric | Value | Description |
Precision | 0.7315 | Ratio of True positive detections / all detections |
Recall | 0.7378 | Ratio of True positives / total actual positives |
mAP@0.5 | 0.8145 | Mean Average Precision at IoU threshold of 0.5 |
mAP@0.5:0.95 | 0.8145 | Mean Average Precision across IoU thresholds from 0.5 to 0.95 |
4.3. Comparison Between YOLOv11N and YOLOv11S
A direct comparison between YOLOv11N and YOLOv11S was conducted using identical datasets, preprocessing steps, and augmentation strategies to ensure fairness. As shown in
Table 3, YOLOv11N outperformed YOLOv11S with a 6.05% improvement in mAP@0.5, despite its significantly smaller parameter count.
While YOLOv11S demonstrated slightly stronger sensitivity to Mild Cognitive Impairment (MCI), it exhibited increased confusion between Alzheimer’s Disease (AD) and Cognitively Normal (CN) classes. In contrast, YOLOv11N achieved higher overall detection accuracy, more stable precision–recall behavior, and lower computational demand, making it better suited for practical and resource-constrained clinical environments.
Importantly, both models support spatial localization, a key advantage over classification-only deep learning approaches.
Table 3. Comparison Metrics of YOLOv11N and YOLOv11S Models.
Model | Type | Augmentations | mAP@0.5 | Precision | Recall | localization | Computational Demand |
YOLOv11N Primary model | Object Detection | flip, scale, mosaic, HSV, translation | 0.8145 | 0.7314 | 0.7378 | Yes | Low |
YOLO11S Baseline model | Object Detection | flip, scale, mosaic, HSV, translation | 0.754 | Threshold dependent | Threshold dependent | Yes | Moderate |
To ensure a rigorous comparison, YOLOv11N and YOLOv11S were evaluated using identical datasets, preprocessing pipelines, and augmentation strategies. YOLOv11N outperformed the larger YOLOv11S architecture, achieving a 6.05% improvement in mAP@0.5 despite its significantly lower parameter count.
While YOLO11S demonstrated marginally higher sensitivity for Mild Cognitive Impairment (MCI), it exhibited frequent misclassification between Alzheimer’s Disease (AD) and Cognitively Normal (CN) cases. In contrast, YOLOv11N provided superior overall detection accuracy and more stable precision-recall performance. Beyond classification accuracy, both models offer spatial localization capabilities a critical diagnostic advantage over traditional black-box classification networks.
Ultimately, YOLOv11N’s balance of high mean Average Precision (mAP) and minimal computational overhead makes it the optimal candidate for integration into resource-constrained clinical environments. Consequently, this study identifies YOLOv11N as the preferred architecture for automated Alzheimer’s disease detection.
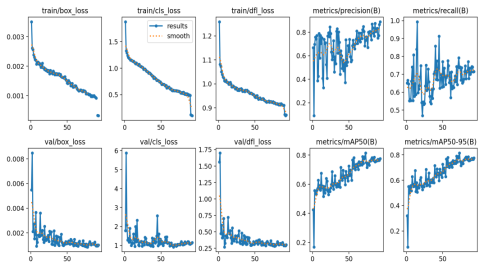
4.4. Training and Validation Loss Analysis of the YOLOv11N Model
The training dynamics of the YOLOv11N model were monitored through several critical loss functions over approximately 90 epochs, as illustrated in
Figure 5. The model demonstrated a robust learning trajectory characterized by the following: Steady Convergence: The bounding box loss (box_loss), classification loss (cls_loss), and distribution focal loss (dfl_loss) all exhibited a consistent downward trend in both the training and validation phases. Generalization: Validation losses closely mirrored the training curves, stabilizing toward the end of the training cycle. This alignment suggests the model successfully learned generalized features for Alzheimer's disease classification without exhibiting signs of significant overfitting. Metric Stability: Both mAP50 and mAP50-95 validation metrics showed a steady upward climb, eventually plateauing near 0.8, indicating reliable detection performance across various Intersection over Union (IoU) thresholds.
The training behavior of the YOLOv11N model was systematically analyzed by monitoring key optimization metrics over approximately 90 training epochs, as the rsults illustrated in
Figure 6. These metrics include the bounding box regression loss (box_loss), classification loss (cls_loss), and distribution focal loss (dfl_loss), evaluated for both the training and validation datasets. Across the training process, all three loss components exhibited a stable and monotonic decreasing trend, indicating effective optimization and progressive refinement of the model parameters. In particular, the box_loss demonstrated consistent reduction, reflecting improved localization accuracy of disease-related brain regions. Similarly, the cls_loss decreased steadily, signifying enhanced discriminative capability among the Alzheimer’s Disease (AD), Mild Cognitive Impairment (MCI), and Cognitively Normal (CN) classes. The dfl_loss, which governs the precision of bounding box boundary estimation, also converged smoothly, confirming stable regression behavior.
Figure 6. Training and Validation Loss Curves for YOLOv11N.
A critical observation is the close alignment between training and validation loss curves throughout the majority of the training period. Validation losses followed the same downward trajectory as training losses and stabilized during the later epochs, indicating strong generalization performance. The absence of divergence or oscillatory behavior between training and validation curves suggests that the model did not suffer from overfitting, despite the inherent class imbalance present in the dataset.
In parallel with loss convergence, the mean Average Precision metrics (mAP50 and mAP50–95) computed on the validation set exhibited a progressive and stable increase over successive epochs. Both metrics eventually plateaued at values approaching 0.8, demonstrating reliable detection accuracy across multiple Intersection over Union (IoU) thresholds. The stabilization of these metrics toward the end of training further confirms that the model reached a well-converged state and achieved consistent performance across varying levels of localization strictness.
Overall, the observed training dynamics confirm that the YOLOv11N model achieved stable convergence, effective generalization, and robust detection performance, validating the suitability of the lightweight YOLOv11N architecture for automated Alzheimer’s disease detection and spatial localization from MRI data.
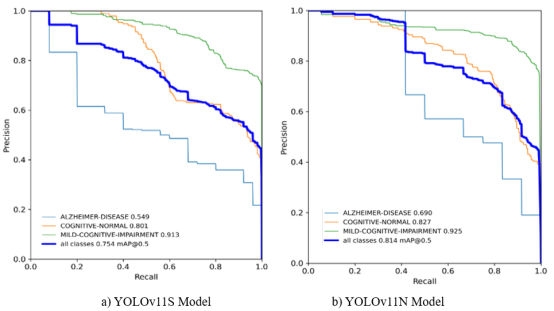
4.5. Model Evaluation Metrics
A comprehensive evaluation of the YOLOv11N and YOLOv11S models was conducted using standard object detection metrics, including Mean Average Precision (mAP), F1-score, precision, and recall, across varying Intersection over Union (IoU) and confidence thresholds. The comparative results provide insight into each model’s convergence behavior, localization accuracy, and class-wise detection robustness.
As shown in
Figure 7, the YOLOv11N model exhibited rapid convergence and high stability throughout training. Its performance remained consistently strong across both mAP@0.5, reflecting relaxed localization criteria, and mAP@0.5–0.95, which imposes stricter spatial accuracy constraints. These results indicate that the lightweight Nano architecture is capable of learning well-generalized spatial features despite its reduced parameter count, making it highly suitable for computationally efficient medical imaging applications. In contrast, the YOLOv11S model demonstrated slower convergence and greater variability across training epochs. Quantitatively, YOLOv11S achieved an overall mAP@0.5 of 0.754 across all diagnostic classes. Class-wise analysis revealed strong performance for Mild Cognitive Impairment (MCI) detection, achieving a high Average Precision (AP) of 0.913, while Alzheimer’s Disease (AD) remained the most challenging class, with an AP of 0.549. These disparities suggest increased sensitivity to class imbalance and difficulty in capturing discriminative features associated with advanced neurodegenerative patterns. Performance instability was particularly pronounced under stricter localization requirements (mAP@0.5–0.95), where precision–recall consistency deteriorated. The mAP trends confirm that YOLOv11N outperformed YOLOv11S in terms of convergence efficiency, localization stability, and robustness across diagnostic classes.
Figure 7. Mean Average Precision-Recall (mAP) curves for mAP@0.5 and mAP@0.5-0.95.
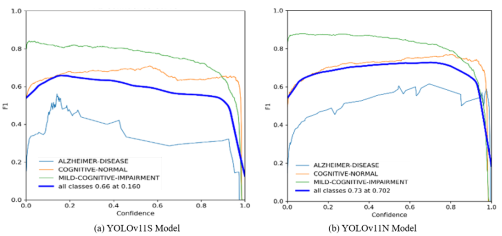
The F1–Confidence curves presented in
Figure 8 illustrate the trade-off between precision and recall across varying confidence thresholds. The YOLOv11N model achieved a superior overall balance, reaching a peak aggregate F1-score of 0.73 at a confidence threshold of 0.702. Notably, the MCI class maintained an F1-score close to 0.85 across a broad range of confidence values, indicating stable and reliable detection.
Conversely, the YOLOv11S model reached a lower peak performance, with an aggregate F1-score of 0.66 at a confidence threshold of 0.160. The curve exhibited high sensitivity to threshold variations, with performance declining sharply beyond the 0.8 confidence level, reflecting reduced robustness under stricter decision criteria.
Figure 8. F1- Confidence curves.
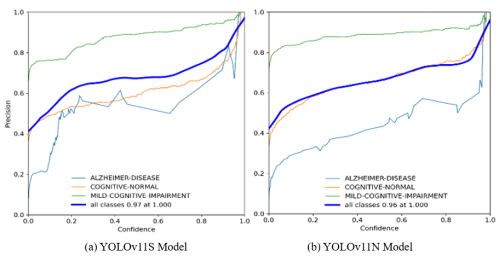
The Precision–Confidence curves shown in
Figure 9 highlight the reliability of predictions as confidence thresholds increase. The YOLOv11S model demonstrated stable precision across a wide confidence range, ultimately achieving an aggregate precision of 1.00 at a confidence level of 0.887. The YOLOv11N model achieved an equivalent peak precision of 1.00, albeit at a slightly higher confidence threshold of 0.916. These results indicate that while both models are highly accurate at high confidence levels, YOLOv11S maintains consistent precision at relatively lower thresholds, likely due to its larger parameter capacity.
Figure 9. Precision–Confidence curves.
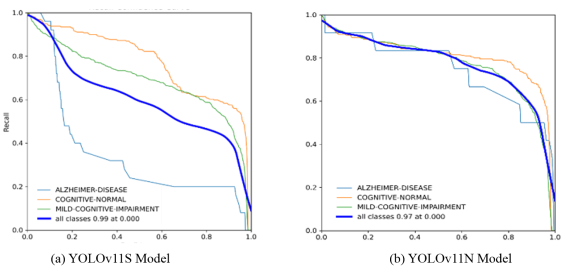
As illustrated in
Figure 10, the Recall–Confidence curves reveal notable differences in detection consistency. The YOLOv11S model achieved a very high initial aggregate recall of 0.99 at a confidence threshold of 0.000; however, its recall declined sharply as confidence increased. This effect was particularly evident for the Alzheimer’s Disease class, where recall dropped below 0.40 before reaching a confidence level of 0.20.
In contrast, the YOLOv11N model demonstrated more balanced recall behavior, achieving an aggregate recall of 0.97 at zero confidence while maintaining substantially higher recall for the AD class (above 0.80) up to a confidence threshold of 0.50. This indicates superior consistency in detecting clinically critical Alzheimer’s cases across varying confidence levels.
Figure 10. Recall–Confidence curves.
These evaluation metrics demonstrate that YOLOv11N provides a more stable and balanced performance profile, particularly for Alzheimer’s Disease detection, while maintaining high localization accuracy and computational efficiency. Although YOLOv11S exhibits strong precision at lower confidence thresholds, its sensitivity to confidence tuning and reduced robustness for the AD class limit its suitability for scalable and reliable clinical deployment.
Per-class performance metrics for both models are reported in
Tables 2 and 3. YOLOv11N achieved balanced detection performance across all classes, with particularly strong results for AD and CN. AD detection benefited from higher recall and improved separability, while CN classification achieved the most stable precision–recall trade-off.
YOLOv11S achieved the highest sensitivity for MCI, reflecting its ability to capture subtle early-stage features. However, this increased sensitivity came at the cost of higher misclassification rates between clinically similar categories. YOLOv11N, while slightly less sensitive for MCI, provided improved robustness and reduced class overlap.
4.6. Confusion Matrix Analysis
As part of this research results, the analysis presented in the confusion matrices provide a detailed evaluation of the classification performance of the YOLOv11S and YOLOv11N models across three clinically relevant categories: Alzheimer’s Disease (AD), Cognitively Normal (CN), and Mild Cognitive Impairment (MCI). These matrices illustrate the distribution of correct classifications and misclassifications, offering insight into each model’s ability to discriminate between healthy, early-stage, and advanced pathological brain states.
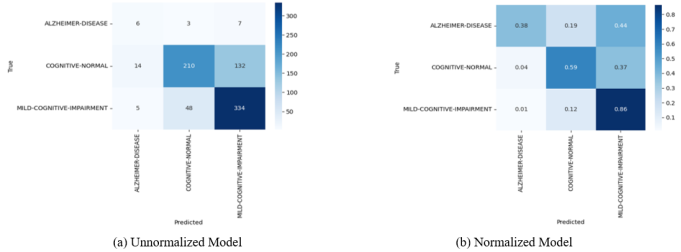
Figure 11. Confusion Matrix for YOLO11S.
As shown in
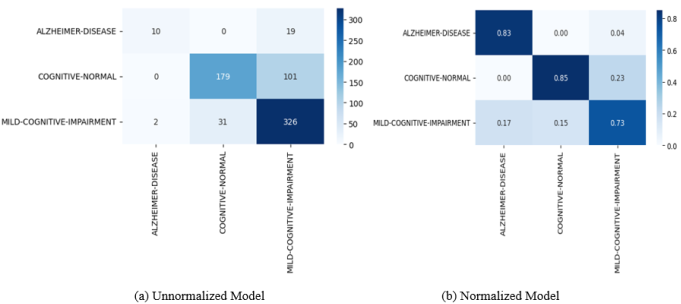
Figure 11, the confusion matrices that demonstrates YOLOv11N model results markedly superior performance in identifying Alzheimer’s Disease. The normalized confusion matrix shown in
Figure 11 indicates that 83% of AD cases are correctly classified, with minimal misclassification into MCI (4%) and no confusion with CN. This high level of accuracy suggests that the Nano architecture effectively captures the distinct structural biomarkers associated with advanced neurodegeneration. In contrast, confusion matrices presented in
Figure 12 using YOLOv11S model exhibits substantial difficulty in accurately detecting AD. Only 38% of AD cases are correctly identified, with a large proportion misclassified as MCI (44%) or CN (19%). This pattern indicates limited separability between advanced and early-stage disease features within the Small variant, reducing its diagnostic reliability for clinically critical AD detection.
YOLOv11N achieves strong performance in identifying cognitively normal individuals, correctly classifying 85% of CN cases. The model shows no confusion between CN and AD, although a modest overlap with MCI (15%) is observed, reflecting the subtle anatomical similarities between normal aging and early impairment while YOLOv11S attains a lower CN classification accuracy of 59% and demonstrates a higher false-positive rate. Notably, 37% of CN scans are misclassified as MCI, suggesting that the Small variant may be overly sensitive to minor anatomical variations that are not indicative of pathological decline.
Figure 12. Confusion Matrix for YOLOv11N.
YOLOv11S exhibits higher sensitivity to Mild Cognitive Impairment, correctly identifying 86% of MCI cases. This performance indicates an enhanced ability to detect subtle early-stage features; however, this sensitivity comes at the cost of increased confusion with AD and CN, reducing overall class separability.
YOLOv11N achieves a slightly lower MCI accuracy of 73%, yet maintains improved clinical consistency by limiting misclassifications into the AD category. This balanced performance suggests that YOLOv11N favors robustness and diagnostic clarity over aggressive sensitivity.
5. Discussion
The results demonstrate that the proposed YOLOv11N-based framework achieves competitive diagnostic performance while maintaining high computational efficiency. More importantly, this work demonstrates how detection-based deep learning can be structured to support clinically interpretable decision-making, bridging the gap between algorithmic performance and practical healthcare impact.
The integration of localized attention maps provides clinicians with transparent insight into model behavior, addressing a key limitation of conventional deep learning systems in medical diagnostics. This interpretability, combined with strong generalization performance, positions the proposed system as a viable candidate for real-world clinical deployment.
The use of 2D slices introduces important limitations. Slice-based models do not explicitly capture inter-slice spatial continuity or volumetric context, which may limit their ability to fully characterize global brain atrophy patterns and long-range structural relationships associated with Alzheimer’s disease progression. As a result, diagnostic predictions are influenced primarily by localized features within individual slices rather than holistic 3D anatomical changes.
YOLOv11N consistently achieves higher precision, recall, and localization stability across confidence thresholds, supporting its suitability for scalable and real-world clinical deployment. A summary of class-wise strengths and limitations is presented in
Table 4, which identifies YOLOv11N as the most balanced model among the evaluated variants.
Table 4. Comparative Performance Metrics of YOLOv11N and YOLOv11S Models.
Metric | YOLOv11N | YOLOv11S | Explanation |
Model Variant | Nano | Small | YOLOv11N is a lightweight architecture optimized for speed and efficiency, while YOLOv11S is deeper with higher representational capacity. |
Approx. Parameters | ~1–3 million | ~7–10 million | YOLOv11N has significantly fewer parameters, reducing computational cost and memory usage. |
Input Resolution | 320 × 320 | 320 × 320 | Both models were trained and evaluated under identical input conditions to ensure a fair comparison. |
mAP@0.5 | 0.8145 | 0.754 | Mean Average Precision at IoU = 0.5; YOLOv11N achieves higher overall detection accuracy. |
mAP@0.5–0.95 | 0.8145 | Lower and less stable | Indicates localization robustness across strict IoU thresholds; YOLOv11N shows stronger consistency. |
Precision (Overall) | 0.7315 | Threshold-dependent | YOLOv11N maintains stable precision across confidence thresholds, whereas YOLOv11S varies more. |
Recall (Overall) | 0.7378 | Threshold-dependent | YOLOv11N achieves balanced sensitivity across classes; YOLOv11S recall drops rapidly with higher confidence. |
F1-Score (Peak) | 0.73 @ conf = 0.70 | 0.66 @ conf = 0.16 | YOLOv11N achieves a higher and more stable balance between precision and recall. |
AD Class AP | 0.690 | 0.549 | YOLOv11N detects Alzheimer’s Disease more reliably with fewer misclassifications. |
MCI Class AP | 0.925 | 0.913 | YOLOv11S shows slightly higher sensitivity to early-stage impairment, though at the cost of stability. |
CN Class AP | 0.827 | 0.810 | Both models perform well on cognitively normal cases, with YOLOv11N showing improved consistency. |
Localization Capability | Yes | Yes | Both models provide spatial localization, a key advantage over classification-only approaches. |
Training Stability | High | Moderate | YOLOv11N converges faster with smoother loss and mAP curves. |
Computational Demand | Low | Moderate | YOLOv11N is better suited for real-time and resource-constrained clinical environments. |
Overall Verdict | Best Overall Balance | High MCI Sensitivity | YOLOv11N offers superior robustness, efficiency, and class balance; YOLOv11S prioritizes sensitivity. |
A broader comparison with representative deep learning approaches is provided in
Table 5. Conventional classification-based methods, including 3D CNNs and CNN–LSTM architectures, often report high predictive accuracy but lack spatial localization capabilities and require substantial computational resources. Multimodal frameworks partially improve feature representation; however, they offer limited image-level interpretability.
In contrast, the proposed YOLO-based framework integrates joint classification and spatial localization, enabling direct visualization of diagnostically relevant brain regions. Among the evaluated YOLO variants, YOLOv11N achieves the most effective balance between accuracy, interpretability, and computational efficiency, positioning it as a practical and clinically meaningful solution for automated Alzheimer’s disease detection.
Table 5. Comparative Performance of YOLOv11N with Representative Deep Learning Approaches.
Model | Type | Accuracy | Provides Localization | Computational Demand |
YOLOv11N (In the study) | Object Detection | 0.8145 mAP@0.5 | Yes | Low-Moderate |
3D CNN (Wen et al., 2022) | Classification | 85.12 AUC | No | High |
Qiu et al. (2022) | Classification | 0.558 (4-class accuracy) | Yes | Very High |
Faster R-CNN | Object Detection | 0.70 mAP@0.5 | Yes | High |
By enabling earlier and more reliable detection of Alzheimer’s disease, the proposed system has the potential to directly improve patient outcomes through timely intervention and personalized treatment planning. Unlike traditional machine learning studies that emphasize accuracy alone, this work demonstrates a clinically integrated approach that prioritizes interpretability, efficiency, and deployment feasibility the key determinants of healthcare impact.
Clinical Significance and Translation Potential
This study is designed with direct clinical deployment in mind. Early and reliable identification of Alzheimer’s disease enables earlier intervention, personalized care planning, and improved patient outcomes. The proposed detection-based framework supports these goals by offering not only diagnostic predictions but also visual evidence that aligns with established neurodegenerative biomarkers, enhancing clinician trust and interpretability.
The lightweight YOLOv11N architecture allows real-time inference on standard clinical hardware, making the system suitable for integration into hospital imaging pipelines and telemedicine platforms. This enables rapid screening in resource-limited settings and supports scalable population-level screening programs.
By unifying interpretability, efficiency, and diagnostic performance, this work advances machine learning from a purely computational tool into a clinically actionable healthcare technology.