Abstract
The increasing demand for reliable and cost-effective energy in oil production facilities has increased the need for optimized Hybrid Renewable Energy Systems (HRES). This study evaluates the technical and economic performance of a hybrid power system for an offshore oil facility using the Hybrid Optimization of Multiple Energy Resources (HOMER) software. The proposed system integrates solar photovoltaic (PV), diesel generators, battery storage, and wind energy. A two-dimensional sensitivity analysis was conducted by varying diesel fuel prices between $0.50–$1.00 per litre and inflation rates between 15–25% to assess their impact on system optimization and economic indicators. Simulation results show that the optimal configuration consists of 25.8 kW solar PV, a 50-kW diesel generator, 15 battery units, and a 22.6 kW converter, supplying the facility over a 20-year project lifetime. The Total Net Present Cost (NPC) increases significantly with rising fuel prices and inflation rates. At lower fuel prices and inflation rates, the PV/Diesel/Battery system is the most economical option, while higher inflation rates favour a PV/Diesel/Wind/Battery configuration. Spider plot analysis indicates that inflation rate has a stronger influence on NPC than fuel price, highlighting the importance of macroeconomic stability in long-term energy planning. These findings provide practical insights for energy planners and policymakers seeking sustainable and resilient power solutions for oil and gas facilities.
|
Published in
|
American Journal of Energy Engineering (Volume 14, Issue 1)
|
|
DOI
|
10.11648/j.ajee.20261401.13
|
|
Page(s)
|
18-26 |
|
Creative Commons
|

This is an Open Access article, distributed under the terms of the Creative Commons Attribution 4.0 International License (http://creativecommons.org/licenses/by/4.0/), which permits unrestricted use, distribution and reproduction in any medium or format, provided the original work is properly cited.
|
|
Copyright
|
Copyright © The Author(s), 2026. Published by Science Publishing Group
|
Keywords
Sensitivity, Optimization, Solar, Simulations, HOMER, Hybrid Energy System (HES)
1. Introduction
Oil facilities, encompassing offshore platforms, refineries, and onshore processing plants, require uninterrupted and dependable energy to maintain operations such as drilling, extraction, processing, and transportation
| [17] | Usman, T., Ahmed, S., Khan, M. Hybrid energy systems for oil platforms: Challenges and opportunities. Energy Systems Research Journal, 2020, 12(3): 45–62. |
[17]
. Historically, these facilities predominantly depend on fossil fuels such as diesel and natural gas for energy production. This reliance results in elevated operational expenses and substantial greenhouse gas (GHG) emissions, exacerbating global warming
| [2] | Aliyu, U. O., Karekezi, S., Zhao, W. Renewable energy integration in offshore oil facilities. Journal of Energy Sustainability, 2020, 18(4): 120–132. |
[2]
. The fluctuation of fuel prices intensifies the financial strain on oil firms, requiring the implementation of improved energy systems that reduce costs while maintaining reliability. The upstream sector of oil and gas is known majorly to produce crude oil and gas. This provides the feedstock for the downstream sector. The abundance of these resources tends to shift the focus of the oil and gas companies towards utilization of these readily available resources in energy provision for their facilities. There are several energy consuming sectors of the oil and gas industry. Notable of them are the transportation, power generation, heating, and HVAC sectors. The use of natural gas and other forms of fossil fuel in providing energy in the oil facilities has been a source of concern to the effort in making the world greener and reducing emissions. Nigeria is not an exception to this challenge to our environment. Oil and gas exploration stated in Nigeria at Oloibiri in 1958. There have been countless environmental challenges ranging from spills to gas flaring and vandalization of oil facilities that have further degraded and polluted the environment. Therefore, the continuous reliance of these companies in the use of fossil fuels to generate energy in their facilities adds to this already bad situation in terms of emission of Greenhouse gases (GHG) to the environment. Fossil fuels account for about 80% of global primary energy consumption
| [8] | International Energy Agency. Key world energy statistics. Paris: International Energy Agency, 2009. |
[8]
. The Kyoto Protocol which brought about the setting up of REDD plus by the UNFCC sets the tone in reduction of greenhouse effect caused by fossil fuels in developing countries. This has triggered a lot of efforts in promoting and enhancing the use of renewables or hybrid energy systems as a strategic response to enhancing carbon stock and reducing afforestation. The offshore upstream oil and gas facilities in Nigeria are majorly self-sustaining with respect to energy generation. Sadly, the use of renewables or hybrid system as an alternative source of energy has been very negligible in the oil and gas sector in Nigeria. This is primarily due to the weak legislations in Nigeria towards emissions, low reportage of spills across host communities and abundance of these resources to the companies. Nigeria and many other Sub-Saharan African Countries are with good solar radiance, moderate wind speed, adequate hydro resources and strong offshore shoreline waves that would support any renewable/hybrid options. Therefore, the onus is on energy experts and researchers to interrogate the continuous use of these fossil fuels by upstream oil and gas companies in an age of deafening cry on the effects of these resources to the climate and come up with workable solutions using the abundant natural resources to save our world from eminent extinction.
However, despite these challenges, Hybrid renewable energy systems (HRES) present a viable option by integrating renewable energy sources—such as solar, wind, and biomass—with traditional energy systems. These systems seek to decrease fuel use, improve energy security, and mitigate environmental effect
| [11] | Karekezi, S., Abdurrahman, M., Zhao, W. Renewable energy in the MENA region: A review of policy and practice. Sustainable Energy Review, 2019, 14(1): 34–50. |
[11]
. Solar photovoltaic (PV) panels provide power during daylight, whereas wind turbines produce electricity in windy situations. Energy storage devices, including batteries, provide a continuous power source by retaining surplus energy for future utilization
| [10] | Jiang, X., Lambert, T., Karekezi, S. Energy storage in hybrid systems: Lessons from the oil industry. Renewable Energy Journal, 2021, 25(2): 89–101. |
[10]
. In oil facilities with high and continuous energy demand, HRES can markedly decrease dependence on diesel generators, which are expensive and produce substantial CO
2 emissions. Furthermore, the incorporation of renewable energy corresponds with international initiatives to shift towards low-carbon energy systems as specified in the Paris Agreement
| [9] | International Energy Agency. Net zero by 2050: A roadmap for the global energy sector. Paris: International Energy Agency, 2021. |
[9].
The techno-economic viability of a hybrid photovoltaic–diesel energy system incorporating battery storage for oil and gas facilities in Nigeria has been analyzed using HOMER software
| [14] | Obuah, E. C., Alalibo, T. J. Techno-economic analysis of hybrid photovoltaic/diesel energy system for oil and gas industries in Nigeria. International Journal of Science and Research, 2017, 6(7): 346–351. https://doi.org/10.21275/ART20174404 |
[14]
. This study contrasts a hybrid photovoltaic-diesel system with a diesel-only system, evaluating costs, environmental effect, and energy reliability using HOMER software. Research indicates that although the diesel-exclusive configuration incurs reduced initial capital expenditures, it results in elevated operational and maintenance costs, along with heightened greenhouse gas emissions. The hybrid system, although more expensive initially, provides long-term savings by decreasing fuel consumption by 37.1%, lowering greenhouse gas emissions by 34.9%, and reducing the cost of energy (COE) by 21.9%. A recognized gap is the insufficient evaluation of issues such as variable diesel prices, inflation rate and alterations in solar irradiation in its sensitivity analysis. The HOMER program is esteemed as an effective instrument for the design and optimization of hybrid energy systems. HOMER software enables simulation of diverse energy configurations and evaluation of their technical and economic feasibility
| [12] | Lambert, T., Gilman, P., Lilienthal, P. Micropower system modeling with HOMER. In: Integration of Alternative Sources of Energy. John Wiley & Sons, 2006: 379–418. |
[12]
. Its functionalities encompass:
1) System Modeling: HOMER simulates intricate energy systems, incorporating renewable and non-renewable resources, storage solutions, and grid interconnections.
2) Optimization: It determines the most economical system configuration by evaluating life-cycle costs, encompassing capital, operating, and maintenance expenditures
.
3) Sensitivity Analysis: HOMER assesses the effects of variable alterations, including fuel pricing, resource availability, and load demand, on system performance.
The aim of this paper is to develop a HOMER optimized Hybrid Renewable Energy System (HRES) in an oil facility. The other objectives are to:
1) Conduct sensitivity analysis to evaluate the influence of key variables on system performance.
2) Offer recommendations for enhancing energy systems in comparable industrial environments.
The offshore oil and gas facility is located on the Forcados River. The name Forcados was given by the Portuguese who discovered the area in the 15th century. Forcados is an ancient town located within Burutu Local Government Area of Delta State
. It was known from history that Forcados and the adjoining Burutu town played host to several slave trade activities that was orchestrated by the Portuguese. There was discovery of petroleum deposits offshore from Burutu in 1964, while crude oil was exported from a loading point at sea after 1965. The present Forcados Terminal, owned by (Shell Petroleum Development Company) SPDC was commissioned in 1971 with several onshore and offshore production platforms supplying crude oil to it for processing and final export. Aside from the Forcados Terminal, there are other SPDC producing platforms within the Forcados area. Forcados Offshore is a shallow offshore location in Burutu Local Government Area of Delta State in Niger-Delta region of Nigeria. The offshore facility is located at latitude 5.25 and longitude 5.75 and a water depth of about 22m of the forcados river
| [1] | Agbakwuru, J., Akaawase, B. Statistical wave description of Forcados offshore in Nigeria. FUPRE Journal of Scientific and Industrial Research, 2019, 3(3). |
[1]
. It comprises of clusters of well and a flowstation with a capacity of about 25,000 Mbopd. There is a Naval Post for security surveillance with a minimum of two personnel that are housed there. The electricity supply to the Naval house comes from the facility. The personnel that operate the facility comes through the boat and journey back to their logistic base after the day’s activities. The production from the platform free flows under gravity to a sister facility for final processing and export to the nearby Forcados Terminal.
Sensitivity analysis in HOMER software is a crucial tool for evaluating the robustness of hybrid renewable energy system designs by testing how variations in input parameters (e.g., fuel prices, wind speed, solar irradiance) impact key performance metrics such as Net Present Cost (NPC), Levelized Cost of Energy (LCOE), and system feasibility. HOMER Pro enables multi-dimensional sensitivity analyses, allowing users to define multiple sensitivity variables and assess their combined effects on optimization results.
. The software systematically evaluates all possible combinations of these variables, ranking feasible configurations by cost-effectiveness and efficiency
. Some key features of sensitivity analysis in HOMER include:
Optimization Integration: Sensitivity runs are coupled with HOMER’s optimization algorithms to determine the lowest-cost system for each sensitivity case.
Graphical and Tabular Outputs: Results are displayed in ranked tables or visual plots, facilitating comparison across different scenarios.
Multi-Variable Testing: Users can assess interactions between variables (e.g., fuel price fluctuations and renewable resource availability) to identify resilient system designs
.
Economic and Technical Metrics: Sensitivity analysis evaluates NPC, operating costs, and energy production stability under varying conditions.
Applications in case studies, such as microgrids in Ecuador, demonstrate how sensitivity analysis validates the economic viability of solar-wind hybrid systems under uncertain resource conditions
| [15] | Solarpack, EPN. Optimal analysis of microgrid with HOMER according to the existing renewable resources in the sector of El Aromo and Villonaco, Ecuador. Proceedings of the XXXI Conference on Electrical and Electronic Engineering, 2023.
https://doi.org/10.3390/engproc47010003 |
[15]
. By incorporating sensitivity analysis, HOMER enhances decision-making in renewable energy planning, ensuring systems remain cost-effective and reliable across diverse real-world scenarios.
The work on design and analysis of clinical trials provided detailed exploration of the key aspects of sensitivity analysis and also took on the key questions of why, how, what, when of sensitivity analysis
| [16] | Thabane, L., Mbuagbaw, L., Goldsmith, C. H. A tutorial on sensitivity analyses in clinical trials: The what, why, when, and how. BMC Medical Research Methodology, 2013, 13(1): 92.
https://doi.org/10.1186/1471-2288-13-92 |
[16]
. Moreover, the paper suggested how to report the results of sensitivity analysis in clinical trials
| [16] | Thabane, L., Mbuagbaw, L., Goldsmith, C. H. A tutorial on sensitivity analyses in clinical trials: The what, why, when, and how. BMC Medical Research Methodology, 2013, 13(1): 92.
https://doi.org/10.1186/1471-2288-13-92 |
[16]
. The identification and qualitative comparison of sensitivity analysis methods have been applied to food-safety risk assessment models, demonstrating that no single method is universally optimal and that the use of multiple theoretical approaches improves confidence in the ranking of influential input parameter
. A newly developed software package, PSUADE (Problem Solving Environment for Uncertainty Analysis and Design Exploration), has been used to evaluate the effectiveness and efficiency of ten widely applied sensitivity analysis methods, comprising seven qualitative and three quantitative approaches
| [5] | Gan, Y., et al. A comprehensive evaluation of various sensitivity analysis methods: A case study with a hydrological model. Environmental Modelling & Software, 2014, 51: 269–285.
https://doi.org/10.1016/j.envsoft.2013.09.031 |
[5]
. All SA methods were tested using a variety of sampling techniques to screen out the most sensitive (i.e., important) parameters from the insensitive ones.
2. Methodology
2.1. System Modelling Using HOMER
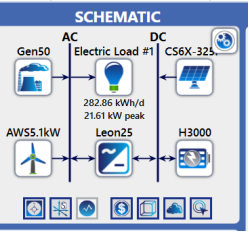
Figure 2. Block diagram of the Hybrid System for the oil facility.
HOMER software was the preferred software for simulation. The technical data, resource data, and cost data were all considered in this model. The off-grid hybrid solution, represented by
Figure 2, consists of four major power sources. They are a diesel generator, Solar PV, wind turbine and storage battery and a converter. The hybrid system for the surfer boat is the diesel generator set, solar PV and storage battery. The Hybrid system includes both alternating current (AC) and Direct Current (DC) components. The AC components are electrical load, converter (Leon25), wind turbine (AWS5.1kW), and the diesel generator (Gen50). The DC components in this hybrid system are solar PV (CS6X-325) and battery (H3000). In the hybrid optimization system as configured in HOMER software, the different power sources were integrated together and complemented each other to serve the peak load while satisfying the criteria of uninterrupted supply of energy. The design of the hybrid system was based on three considerations: technical, economical, and environmental. The technical characteristics were taken into consideration when choosing the design specification and components. For economic consideration, HOMER will be used to simulate and to select the cost-effective option. Finally, environmental consideration was made when choosing a location for the system - mainly the availability of solar data, temperature and wind speed.
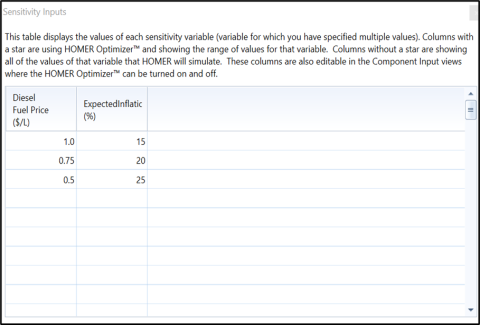
2.2. Sensitivity Analysis Variables
The consideration for sensitivity analysis is to determine how “sensitive” the outputs are to changes in a particular input variable. This analysis is performed by entering multiple values for a particular input variable. The outcome on the output variable determines how important that variable is, and how the solution changes depending on its value. HOMER repeats its optimization process for each value of the variable and lets one see how the results are affected. An input variable for which one has a specified multiple values is called a sensitivity variable. A sensitivity analysis can be one-dimensional if a single sensitivity variable is involved. It is considered a two-dimensional sensitivity analysis if there are two sensitivity variables. Another importance of this analysis is that it helps to have an optimal case scenario considering the changing variables.
Since this study is specifically for Nigeria and other Sub-regional West African countries, input variables like fuel price and inflation are classified impactful in the day-to-day living of the populace hence their consideration as the focus variables in this two-dimensional sensitivity analysis. The fuel price was varied between $0.5, $0.75, & $1.00 in this analysis while inflation rate was varied from 15%, 20% and 25% as seen in
Figure 3 below.
Figure 3. Independent variables of the sensitivity analysis.
The sensitivity analysis was done from three perspectives: the optimal plot diagram, surface plot, and spider plot analysis.
3. Result and Discussion
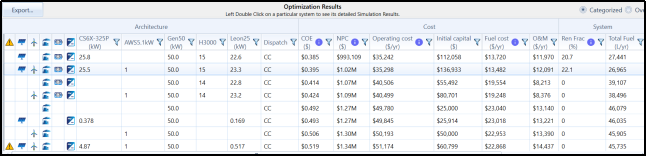
HOMER software utilized the data that was inputted in chapter three simulation and recommended the optimal hybrid system architecture can meet the criteria. A total of 43,560 simulation runs were completed in 10:54:04 time. These simulations were performed for twenty years of system operation. There is an assumption of HOMER software that all prices change at the same rate.
Figure 4. HOMER optimized system (PV/Diesel/Battery).
The optimal configuration as seen from
Figure 4 consists of:
1) 25.8 kW Solar PV
2) 1 Diesel Generator (50 kW)
3) 15 units of H3000 Battery
4) 22.6 kW converter (Leon25)
3.1. Optimized Solar PV for the Facility
The Solar PV is optimized for 25.8kW energy output. It was noted earlier that 403 PV panels would be needed to provide uninterrupted power for the oil facility if Solar were to be the only source of energy. The optimized solar energy in the Hybrid systems would now amount to the following.
Number of PV panels needed = Total installed PV capacity/Panel rating.
The optimized capacity = 25.8 kW
For a 325W rated panel, the value of panel rating = 325W or 0.325 kW
Therefore, the number of panels required for a 325W panel = 25.8/0.325 = 79.4 panels
Alternatively, a 600W panel rating will produce 25.8/0.6 = 43 panels
Therefore, in an optimized HRES, 43 PV Panels that is rated 600W will be required.
3.2. Optimized Battery System
The optimized hybrid system proposed a total of 15 ‘Hoppecke 24 OPzS 3000’ batteries. It could be recalled from earlier sections that the calculated number of H3000 batteries was 274 batteries if the battery system were to stand alone system, but the optimized system from the HOMER simulation indicates 15 units of the battery is required in the optimized Hybrid Renewable Energy system (HRES).
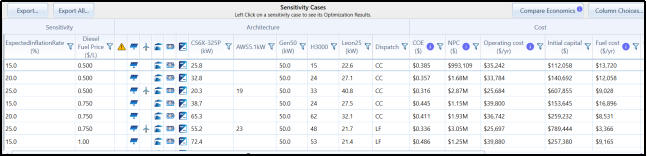
3.3. Sensitivity Analysis Result
Figure 5. HOMER sensitivity results for the facility.
The sensitivity result shown above indicates that the at lower fuel prices and lower inflation rate, the optimized HRES of PV/Diesel/Battery are the preferred. Further sensitivity results are gotten from the optimal, surface and spider plot analysis,
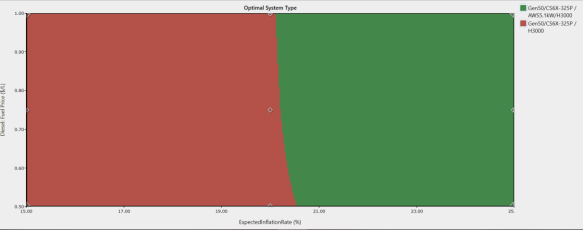
3.3.1. Optimal Plot Analysis
The sensitivity analysis result as seen from
Figure 6 shows how variations in the fuel prices and inflation rate affects the optimal system type. The green coloured section is labelled (Gen50/CS6X-325P/AW55.1KW/H3000) which represents (PV/Diesel/Wind/Battery) system while the pink-coloured section represents (Gen50/CS6X-325P/H300) which is the (PV/Diesel/Battery) system.
The (PV/Diesel/Battery) hybrid Renewable Energy System (HRES) is the optimal system type. As the fuel price changes from $0.5, through to $1.00 and Inflation rises from 15% getting towards 21%, The (PV/Diesel/Battery) occupied a half of the graph. It was at a higher inflation rate of 20.7% to 25% that the (PV/Diesel/Wind/Battery) was the preferred option. This in turn validates the earlier economic consideration that the (PV/Diesel/Battery) which is optimized HRES ranks far higher than others in the economic scale. This sensitivity analysis also highlights how changes in fuel prices and inflation rate affect the optimisation and consideration of the choice of HRES. Presently in Nigeria, the rise in fuel prices since the end of subsidy on the 23rd of May 2023 to October 2024 increased it from N195.00 to N1,200 which is about 515% increment. Inflation has also risen from 22.2% to 29.0% between May 2023 to October 2024 which is about 31% increase within the stated period. The changes in Nigeria’s fuel prices and inflation within a space of one year and few months underscore the importance of its consideration in the sensitivity analysis. It will be right to say that the two factors considered have immense capacity to determine the choice of the HRES to be used in this optimisation hence the analysis.
Figure 6. Optimal system plot diagram.
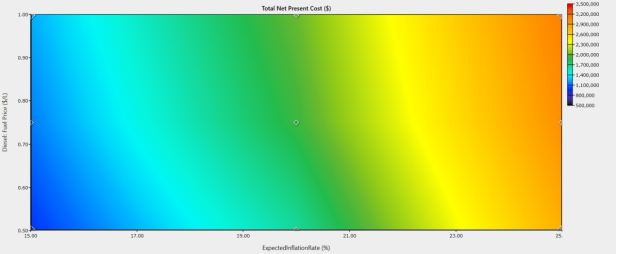
3.3.2. Surface Plot Analysis
Figure 7. Surface plot diagram.
The surface plot, as a subset of sensitivity analysis, employs the variables under examination. The fluctuating fuel costs (X-axis) and inflation rates (Y-axis). As the two independent variables fluctuate, a corresponding alteration in the dependent variable (Total net present cost) on the Z-axis transpires. The surface plot in
Figure 7 indicates that a decrease in fuel costs and inflation rates results in a diminished total net present cost. This is evident from the legend depicted in
Figure 7 The graph's colour transitions progressively, indicating increased pricing as the two independent variables vary. This further substantiates that fuel costs and inflation rates are significant factors in determining the selection of hybrid renewable energy systems, since the total net present cost serves as a crucial optimization instrument for assessing the economic viability of such systems.
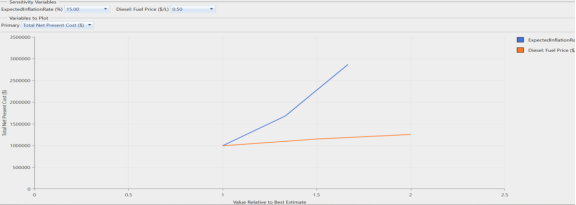
3.3.3. Spider Plot Analysis
Figure 8. Spider Plot diagram.
This study looked at two variables of fuel cost and inflation rate. In the HOMER sensitivity simulation, the fuel price ranges across $0.5, $0.75 & $1.0. The inflation rate was 15%, 20% and 25% respectively. Analysing the spider plot diagram in
Figure 8 the slope of the inflation rate which is coloured blue is steeper than the fuel price that is coloured red. The dependent variable (Net Present Cost) on the Y-axis responds to the changes of the independent variables. Therefore, the Total Net Present Cost is more sensitive to changes in inflation rate than fuel prices. This suggests that efforts to reduce inflation rate (e.g., by lower cost of procurement) could significantly add more renewable capacities to the hybrid system. This analysis helps the stakeholders like the government and the oil and gas to allocate resources and identify potential risk to due to variable uncertainties. This implies when the government increases the inflation rate of the country, it will have significant reduction in the availability of renewable capabilities to the citizenry. Conversely, a reduction in the inflation rate will encourage more renewable presence through cost reduction.
4. Conclusion
The sensitivity analysis was done by varying the fuel cost and inflation rate. It was very instructive to use this in Nigeria because of the effect of these independent variables on the economy and the livelihood of the populace. There were three analysis that was done under this section. The optimal system plot, the surface plot and the spider plot analysis. Optimal system plot of the sensitivity analysis indicated that varying fuel cost and inflation rate influenced the choice of optimal system. A lower value of fuel cost and inflation rate choose the optimized system of PV/Diesel/Battery while a higher rate of fuel cost and inflation rate opted for the second best which was PV/Diesel/Wind/Battery optimized system. The surface plot diagram showed that a lower fuel cost and inflation rate affected the Total Net Present Cost with a reduced value while higher rates of the independent variables (Fuel cost & inflation rate) had higher values of Net Present Cost. The spider plot indicates that the inflation rate had more influence than fuel costs as it relates to the Total Net present Cost.
5. Policy Implications and Recommendations
The findings from this sensitivity analysis of a Hybrid Renewable Energy System (HRES) in an oil facility using HOMER software offer critical perspectives for energy policy formulation in Nigeria and similar Sub-Saharan African contexts. The results bring to focus the economic and technical viability of integrating renewable energy sources into oil and gas operations, especially under unstable fuel pricing and inflationary pressures as seen in the present-day Nigeria. To translate these technical insights into actionable policy, the following recommendations are proposed:
5.1. Incentivize Adoption of Hybrid Energy in Oil Facilities
1) Policy Gap: Nigeria’s upstream oil sector lacks enforceable mandates or incentives for renewable energy integration.
2) Recommendation: Introduce fiscal incentives such as tax credits, accelerated depreciation, and import duty waivers for renewable energy components used in oil facilities. These incentives should be attached to measurable reductions in diesel consumption and GHG emissions.
5.2. Create Emission Reduction Targets for Industrial Energy Use
1) Policy Gap: Emission targets in Nigeria are largely focused on power generation and transport, with minimal attention to industrial energy use.
2) Recommendation: Expand Nigeria’s Nationally Determined Contributions (NDCs) under the Paris Agreement to include sector-specific targets for oil and gas facilities. This should include mandatory reporting of energy mix and emissions, with penalties for non-compliance and rewards for exceeding targets.
5.3. Create a Renewable Energy Commitment for Oil Companies
1) Policy Gap: There is no binding requirement for oil companies to diversify their energy sources.
2) Recommendation: Enact legislation that requires oil companies to source a minimum percentage (e.g., 20%) of their operational energy from renewable or hybrid systems by 2030. This obligation should be enforced by the Department of Petroleum Resources (DPR) and integrated into licensing and renewal processes.
5.4. Mitigate Inflationary Impacts Through Local Manufacturing
1) Policy Insight: The spider plot analysis revealed inflation as a more significant driver of Net Present Cost than fuel prices.
2) Recommendation: Support local manufacturing of solar panels, batteries, and wind components to reduce exposure to foreign exchange volatility and import inflation. This can be achieved through public-private partnerships and directed subsidies for renewable tech startups.
5.5. Develop a National Hybrid Energy Strategy for Industrial Applications
1) Policy Gap: Nigeria’s renewable energy policies are largely concentrated on rural electrification and grid expansion.
2) Recommendation: Formulate a national strategy that promotes hybrid energy systems in industrial sectors, especially oil and gas. This strategy should include technical guidelines, financing models, and integration protocols for HOMER-based optimization.
5.6. Consolidate Data Collection and Simulation Capacity
1) Policy Insight: HOMER simulations rely heavily on accurate resource and economic data.
2) Recommendation: Invest in national data infrastructure to support real-time monitoring of solar irradiance, wind speed, fuel prices, and inflation. This will improve the accuracy of hybrid system modeling and support evidence-based policymaking.
Abbreviations
HRES | Hybrid Renewable Energy System |
HOMER | Hybrid Optimization of Multiple Energy Resources |
NPC | Net Present Cost |
COE | Cost of Energy |
PV | Photovoltaic |
GHG | Greenhouse Gas |
Conflicts of Interest
The authors declare no conflicts of interest.
References
| [1] |
Agbakwuru, J., Akaawase, B. Statistical wave description of Forcados offshore in Nigeria. FUPRE Journal of Scientific and Industrial Research, 2019, 3(3).
|
| [2] |
Aliyu, U. O., Karekezi, S., Zhao, W. Renewable energy integration in offshore oil facilities. Journal of Energy Sustainability, 2020, 18(4): 120–132.
|
| [3] |
Binebai, P. Forcados: The untold story of where Nigeria began. Gbaramatu Voice, 2016. Available:
https://www.gbaramatuvoicenews.com/forcados-the-untold-story-of-where-nigeria-began/
|
| [4] |
Frey, H. C., Patil, S. R. Identification and review of sensitivity analysis methods. Risk Analysis, 2002, 22(3): 553–578.
https://doi.org/10.1111/0272-4332.00039
|
| [5] |
Gan, Y., et al. A comprehensive evaluation of various sensitivity analysis methods: A case study with a hydrological model. Environmental Modelling & Software, 2014, 51: 269–285.
https://doi.org/10.1016/j.envsoft.2013.09.031
|
| [6] |
HOMER Energy. HOMER software overview. HOMER Energy, 2023. Available:
https://www.homerenergy.com
|
| [7] |
HOMER Energy. Sensitivity analysis. HOMER Pro 3.15 Documentation, 2025. Available:
https://homerenergy.com/products/pro/docs/3.15/sensitivity_analysis.html
|
| [8] |
International Energy Agency. Key world energy statistics. Paris: International Energy Agency, 2009.
|
| [9] |
International Energy Agency. Net zero by 2050: A roadmap for the global energy sector. Paris: International Energy Agency, 2021.
|
| [10] |
Jiang, X., Lambert, T., Karekezi, S. Energy storage in hybrid systems: Lessons from the oil industry. Renewable Energy Journal, 2021, 25(2): 89–101.
|
| [11] |
Karekezi, S., Abdurrahman, M., Zhao, W. Renewable energy in the MENA region: A review of policy and practice. Sustainable Energy Review, 2019, 14(1): 34–50.
|
| [12] |
Lambert, T., Gilman, P., Lilienthal, P. Micropower system modeling with HOMER. In: Integration of Alternative Sources of Energy. John Wiley & Sons, 2006: 379–418.
|
| [13] |
Morris, T. P., et al. Proposals for the design and reporting of sensitivity analyses in clinical trials. Clinical Trials, 2014, 11(5): 621–631.
https://doi.org/10.1177/1740774514553049
|
| [14] |
Obuah, E. C., Alalibo, T. J. Techno-economic analysis of hybrid photovoltaic/diesel energy system for oil and gas industries in Nigeria. International Journal of Science and Research, 2017, 6(7): 346–351.
https://doi.org/10.21275/ART20174404
|
| [15] |
Solarpack, EPN. Optimal analysis of microgrid with HOMER according to the existing renewable resources in the sector of El Aromo and Villonaco, Ecuador. Proceedings of the XXXI Conference on Electrical and Electronic Engineering, 2023.
https://doi.org/10.3390/engproc47010003
|
| [16] |
Thabane, L., Mbuagbaw, L., Goldsmith, C. H. A tutorial on sensitivity analyses in clinical trials: The what, why, when, and how. BMC Medical Research Methodology, 2013, 13(1): 92.
https://doi.org/10.1186/1471-2288-13-92
|
| [17] |
Usman, T., Ahmed, S., Khan, M. Hybrid energy systems for oil platforms: Challenges and opportunities. Energy Systems Research Journal, 2020, 12(3): 45–62.
|
Cite This Article
-
APA Style
Obiabuchi, U. A., Olabisi, O. T. (2026). Sensitivity Analysis of a Hybrid Renewable Energy System in an Oil Facility Using HOMER. American Journal of Energy Engineering, 14(1), 18-26. https://doi.org/10.11648/j.ajee.20261401.13
 Copy
|
Copy
|
 Download
ACS Style
Obiabuchi, U. A.; Olabisi, O. T. Sensitivity Analysis of a Hybrid Renewable Energy System in an Oil Facility Using HOMER. Am. J. Energy Eng. 2026, 14(1), 18-26. doi: 10.11648/j.ajee.20261401.13
Copy
|
Download
AMA Style
Obiabuchi UA, Olabisi OT. Sensitivity Analysis of a Hybrid Renewable Energy System in an Oil Facility Using HOMER. Am J Energy Eng. 2026;14(1):18-26. doi: 10.11648/j.ajee.20261401.13
Copy
|
Download
-
@article{10.11648/j.ajee.20261401.13,
  author = {Ukwu Alphonsus Obiabuchi and Odutola Toyin Olabisi},
  title = {Sensitivity Analysis of a Hybrid Renewable Energy System in an Oil Facility Using HOMER},
  journal = {American Journal of Energy Engineering},
  volume = {14},
  number = {1},
  pages = {18-26},
  doi = {10.11648/j.ajee.20261401.13},
  url = {https://doi.org/10.11648/j.ajee.20261401.13},
  eprint = {https://article.sciencepublishinggroup.com/pdf/10.11648.j.ajee.20261401.13},
  abstract = {The increasing demand for reliable and cost-effective energy in oil production facilities has increased the need for optimized Hybrid Renewable Energy Systems (HRES). This study evaluates the technical and economic performance of a hybrid power system for an offshore oil facility using the Hybrid Optimization of Multiple Energy Resources (HOMER) software. The proposed system integrates solar photovoltaic (PV), diesel generators, battery storage, and wind energy. A two-dimensional sensitivity analysis was conducted by varying diesel fuel prices between $0.50–$1.00 per litre and inflation rates between 15–25% to assess their impact on system optimization and economic indicators. Simulation results show that the optimal configuration consists of 25.8 kW solar PV, a 50-kW diesel generator, 15 battery units, and a 22.6 kW converter, supplying the facility over a 20-year project lifetime. The Total Net Present Cost (NPC) increases significantly with rising fuel prices and inflation rates. At lower fuel prices and inflation rates, the PV/Diesel/Battery system is the most economical option, while higher inflation rates favour a PV/Diesel/Wind/Battery configuration. Spider plot analysis indicates that inflation rate has a stronger influence on NPC than fuel price, highlighting the importance of macroeconomic stability in long-term energy planning. These findings provide practical insights for energy planners and policymakers seeking sustainable and resilient power solutions for oil and gas facilities.},
 year = {2026}
}
Copy
|
Download
-
TY  - JOUR
T1  - Sensitivity Analysis of a Hybrid Renewable Energy System in an Oil Facility Using HOMER
AU  - Ukwu Alphonsus Obiabuchi
AU  - Odutola Toyin Olabisi
Y1  - 2026/02/06
PY  - 2026
N1  - https://doi.org/10.11648/j.ajee.20261401.13
DO  - 10.11648/j.ajee.20261401.13
T2  - American Journal of Energy Engineering
JF  - American Journal of Energy Engineering
JO  - American Journal of Energy Engineering
SP  - 18
EP  - 26
PB  - Science Publishing Group
SN  - 2329-163X
UR  - https://doi.org/10.11648/j.ajee.20261401.13
AB  - The increasing demand for reliable and cost-effective energy in oil production facilities has increased the need for optimized Hybrid Renewable Energy Systems (HRES). This study evaluates the technical and economic performance of a hybrid power system for an offshore oil facility using the Hybrid Optimization of Multiple Energy Resources (HOMER) software. The proposed system integrates solar photovoltaic (PV), diesel generators, battery storage, and wind energy. A two-dimensional sensitivity analysis was conducted by varying diesel fuel prices between $0.50–$1.00 per litre and inflation rates between 15–25% to assess their impact on system optimization and economic indicators. Simulation results show that the optimal configuration consists of 25.8 kW solar PV, a 50-kW diesel generator, 15 battery units, and a 22.6 kW converter, supplying the facility over a 20-year project lifetime. The Total Net Present Cost (NPC) increases significantly with rising fuel prices and inflation rates. At lower fuel prices and inflation rates, the PV/Diesel/Battery system is the most economical option, while higher inflation rates favour a PV/Diesel/Wind/Battery configuration. Spider plot analysis indicates that inflation rate has a stronger influence on NPC than fuel price, highlighting the importance of macroeconomic stability in long-term energy planning. These findings provide practical insights for energy planners and policymakers seeking sustainable and resilient power solutions for oil and gas facilities.
VL  - 14
IS  - 1
ER  -
Copy
|
Download