This paper defines and explains, in simple and clear terms, key concepts of descriptive statistics and connects statistical theory with applied statistical practice through real cases. It begins by clarifying the meaning of statistics and the basic notions used daily in many fields, while distinguishing statistics as a science and an art from statistics understood as data and measures. The study adopts the following definition: “Statistics is simply an art and a science that allows for the collection, analysis, presentation, and interpretation of data for the purpose of making decisions about any phenomenon under study.” To illustrate these concepts, practical applications were carried out using real data from two institutions: AL BANK and a non-governmental organization. For the calculations and applications, EXCEL, EVIEWS, and R STUDIO were used. In the AL BANK case, relative frequencies were calculated step by step with the three software programs and then verified manually using the mathematical frequency formula. In Excel, the process involved entering the data, computing the total number of observations, and calculating the relative frequencies. In EVIEWS, the observations were entered, descriptive statistical measures including the total were obtained, and relative frequencies were then calculated. In R STUDIO, the data were entered as a vector and relative frequencies were computed. The three methods produced identical results, showing that 66% of AL BANK employees are single, 31% are married, 2% are widowed, and 1% is divorced. In the non-governmental organization case, the variable “business opening” was used to calculate cumulative frequencies. The procedure consisted of constructing the absolute frequency table, the relative frequency table, and then the cumulative absolute and cumulative relative frequency tables. The analysis showed that, in terms of cumulative absolute frequency, ten individuals reported that they sometimes or often open their businesses. Regarding relative frequencies, six out of sixteen individuals reported often opening their businesses (37.5%), while 25% sometimes open their businesses, 25% rarely open them, and 12.5% never open them. These findings highlight the importance of frequency as the one of the fundamental concepts of applied statistics.
| Published in | American Journal of Applied Mathematics (Volume 14, Issue 3) |
| DOI | 10.11648/j.ajam.20261403.13 |
| Page(s) | 129-138 |
| Creative Commons |
This is an Open Access article, distributed under the terms of the Creative Commons Attribution 4.0 International License (http://creativecommons.org/licenses/by/4.0/), which permits unrestricted use, distribution and reproduction in any medium or format, provided the original work is properly cited. |
| Copyright |
Copyright © The Author(s), 2026. Published by Science Publishing Group |
Descriptive Statistics, Applications, Excel, EVIEWS, R STUDIO
Entrepreneur | How old are you? | At what rhythm are you opening your business? | Do you live alone or with your partner? |
|---|---|---|---|
1 | 19 | often | alone |
2 | 20 | never | partner |
3 | 25 | sometimes | partner |
4 | 18 | never | alone |
5 | 18 | rarely | alone |
6 | 35 | sometimes | partner |
7 | 50 | rarely | partner |
8 | 37 | sometimes | alone |
9 | 60 | often | partner |
10 | 42 | often | partner |
11 | 34 | rarely | alone |
12 | 56 | sometimes | partner |
13 | 33 | often | alone |
14 | 79 | often | partner |
15 | 40 | rarely | alone |
16 | 45 | often | partner |
At what rhythm are you opening your business? | Absolute Frequency |
|---|---|
often | 6 |
sometimes | 4 |
rarely | 4 |
never | 2 |
Total | 16 |
At what rhythm are you opening your business? | Absolute Frequency | Cumulative Absolute Frequency |
|---|---|---|
Often | 6 | 6 |
Sometimes | 4 | 10 |
rarely | 4 | 14 |
never | 2 | 16 |
Total | 16 |
At what rhythm are you opening your business? | Absolute Frequency | Cumulative Absolute Frequency | Relative Frequency (%) |
|---|---|---|---|
often | 6 | 6 | 37,5 |
sometimes | 4 | 10 | 25 |
rarely | 4 | 14 | 25 |
never | 2 | 16 | 12,5 |
Total | 16 | 100 |
Fi | Relative Frequency |
i | Modality of Character |
n | Individual Size |
N | Population Size |
ni | Absolute Frequency or Effective of i Modality |
| Sigma Is a Greek Letter, It Is Used to Indicate Summation of Elements Like Sample, Population, etc. |
| [1] | MBAYO YAMWEMBO, A. Applied statistics of Business: Analysis of practical cases using EVIEWS and SPSS. working paper. prosinec 2025. |
| [2] | ANDERSON, D. R., SWEENEY, D. J., WILLIAMS, T. A. Statistics for Business and Economics. 11. ed. Mason, Ohio: South-Western, 2011. |
| [3] |
DE SÈDE-MARCEAU, M.-H. introduction to the descriptive statistics [online]. course notes. 2010. Dostupné z: chrome-extension:
https://www.mcours.net/cours/pdf/econm/Introduction_a_la_statistique_descriptive.pdf |
| [4] | MASAMBA FAMODE, D. Elements of descriptive statistics. la tourbière. 2023. |
| [5] | MONTGOMERY, D. C., RUNGER, G. C. Applied Statistics and Probability for Engineers. Seventh edition. Hoboken, NJ: Wiley, 2018. EMEA edition. |
| [6] | MIAH, A. Q. Applied Statistics for Social and Management Sciences [online]. 1st ed. 2016. Singapore: Springer, 2016. SpringerLink Bücher. Dostupné z: |
| [7] |
A. SHAYIB, M. Applied Statistics [online]. 1 st. Ethiopia: bookboon, 2013. Dostupné z: chrome-extension:
http://ndl.ethernet.edu.et/bitstream/123456789/31227/1/Mohammed%20A.Shayb.pdf |
| [8] | ANDERSON, D. R., SWEENEY, D. J. (eds.). Statistics for Business and Economics 12e. 12. ed. Mason, Ohio: South-Western, Cengage Learning, 2014. |
| [9] | MCCLAVE, J. T., BENSON, P. G., SINCICH, T. Statistics for Business and Economics. 14 edition, global edition. Harlow, England: Pearson, 2022. |
| [10] | TERRAZA, V., TOQUE, C. Statistical analysis for banking and financial management: applications with R. Bruxelles: Of superior Boeck, 2013. Economic openings. |
APA Style
Yamwembo, A. M. (2026). The First Notions of Descriptive Statistics Applications with EXCEL, EVIEWS and R STUDIO. American Journal of Applied Mathematics, 14(3), 129-138. https://doi.org/10.11648/j.ajam.20261403.13
ACS Style
Yamwembo, A. M. The First Notions of Descriptive Statistics Applications with EXCEL, EVIEWS and R STUDIO. Am. J. Appl. Math. 2026, 14(3), 129-138. doi: 10.11648/j.ajam.20261403.13
@article{10.11648/j.ajam.20261403.13,
  author = {Alain Mbayo Yamwembo},
  title = {The First Notions of Descriptive Statistics Applications with EXCEL, EVIEWS and R STUDIO},
  journal = {American Journal of Applied Mathematics},
  volume = {14},
  number = {3},
  pages = {129-138},
  doi = {10.11648/j.ajam.20261403.13},
  url = {https://doi.org/10.11648/j.ajam.20261403.13},
  eprint = {https://article.sciencepublishinggroup.com/pdf/10.11648.j.ajam.20261403.13},
  abstract = {This paper defines and explains, in simple and clear terms, key concepts of descriptive statistics and connects statistical theory with applied statistical practice through real cases. It begins by clarifying the meaning of statistics and the basic notions used daily in many fields, while distinguishing statistics as a science and an art from statistics understood as data and measures. The study adopts the following definition: “Statistics is simply an art and a science that allows for the collection, analysis, presentation, and interpretation of data for the purpose of making decisions about any phenomenon under study.” To illustrate these concepts, practical applications were carried out using real data from two institutions: AL BANK and a non-governmental organization. For the calculations and applications, EXCEL, EVIEWS, and R STUDIO were used. In the AL BANK case, relative frequencies were calculated step by step with the three software programs and then verified manually using the mathematical frequency formula. In Excel, the process involved entering the data, computing the total number of observations, and calculating the relative frequencies. In EVIEWS, the observations were entered, descriptive statistical measures including the total were obtained, and relative frequencies were then calculated. In R STUDIO, the data were entered as a vector and relative frequencies were computed. The three methods produced identical results, showing that 66% of AL BANK employees are single, 31% are married, 2% are widowed, and 1% is divorced. In the non-governmental organization case, the variable “business opening” was used to calculate cumulative frequencies. The procedure consisted of constructing the absolute frequency table, the relative frequency table, and then the cumulative absolute and cumulative relative frequency tables. The analysis showed that, in terms of cumulative absolute frequency, ten individuals reported that they sometimes or often open their businesses. Regarding relative frequencies, six out of sixteen individuals reported often opening their businesses (37.5%), while 25% sometimes open their businesses, 25% rarely open them, and 12.5% never open them. These findings highlight the importance of frequency as the one of the fundamental concepts of applied statistics.},
 year = {2026}
}
TY  - JOUR
T1  - The First Notions of Descriptive Statistics Applications with EXCEL, EVIEWS and R STUDIO
AU  - Alain Mbayo Yamwembo
Y1  - 2026/05/21
PY  - 2026
N1  - https://doi.org/10.11648/j.ajam.20261403.13
DO  - 10.11648/j.ajam.20261403.13
T2  - American Journal of Applied Mathematics
JF  - American Journal of Applied Mathematics
JO  - American Journal of Applied Mathematics
SP  - 129
EP  - 138
PB  - Science Publishing Group
SN  - 2330-006X
UR  - https://doi.org/10.11648/j.ajam.20261403.13
AB  - This paper defines and explains, in simple and clear terms, key concepts of descriptive statistics and connects statistical theory with applied statistical practice through real cases. It begins by clarifying the meaning of statistics and the basic notions used daily in many fields, while distinguishing statistics as a science and an art from statistics understood as data and measures. The study adopts the following definition: “Statistics is simply an art and a science that allows for the collection, analysis, presentation, and interpretation of data for the purpose of making decisions about any phenomenon under study.” To illustrate these concepts, practical applications were carried out using real data from two institutions: AL BANK and a non-governmental organization. For the calculations and applications, EXCEL, EVIEWS, and R STUDIO were used. In the AL BANK case, relative frequencies were calculated step by step with the three software programs and then verified manually using the mathematical frequency formula. In Excel, the process involved entering the data, computing the total number of observations, and calculating the relative frequencies. In EVIEWS, the observations were entered, descriptive statistical measures including the total were obtained, and relative frequencies were then calculated. In R STUDIO, the data were entered as a vector and relative frequencies were computed. The three methods produced identical results, showing that 66% of AL BANK employees are single, 31% are married, 2% are widowed, and 1% is divorced. In the non-governmental organization case, the variable “business opening” was used to calculate cumulative frequencies. The procedure consisted of constructing the absolute frequency table, the relative frequency table, and then the cumulative absolute and cumulative relative frequency tables. The analysis showed that, in terms of cumulative absolute frequency, ten individuals reported that they sometimes or often open their businesses. Regarding relative frequencies, six out of sixteen individuals reported often opening their businesses (37.5%), while 25% sometimes open their businesses, 25% rarely open them, and 12.5% never open them. These findings highlight the importance of frequency as the one of the fundamental concepts of applied statistics.
VL  - 14
IS  - 3
ER  -
Department of Economics, University of Kinshasa, Kinshasa, Democratic Republic of Congo (DRC)
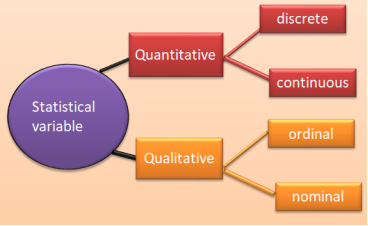
Figure 1. Types of statistics variables.
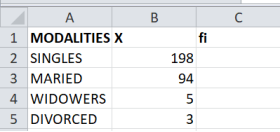
Figure 2. Modalities data.
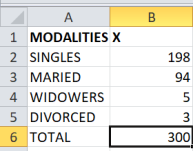
Figure 3. Modalities sum.
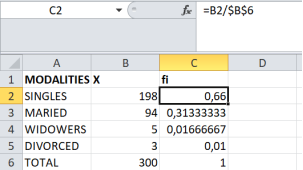
Figure 4. Relative frequency calculations.
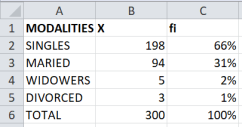
Figure 5. Using EXCEL% to relative frequency calculations.
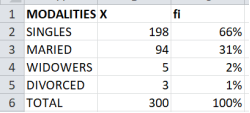
Figure 6. Relative frequency in percentage (%).
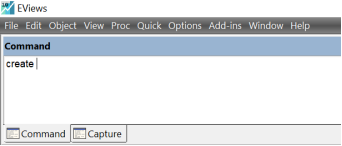
Figure 7. EVIEWS Command bar.
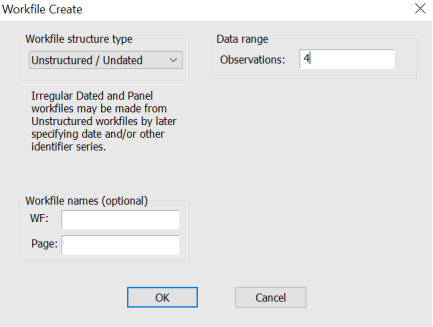
Figure 8. EVIEWS Workfile.
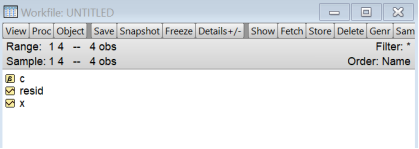
Figure 9. Workfile creation.
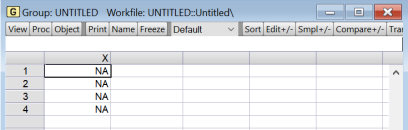
Figure 10. Data workfile.
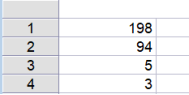
Figure 11. Data Entered.
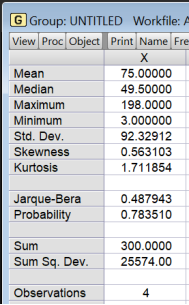
Figure 12. EVIEWS output Statistics.
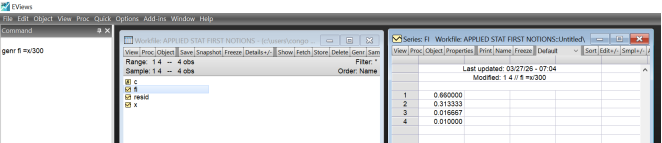
Figure 13. Relative Frequency using Genr command.
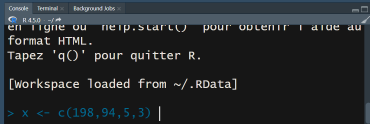
Figure 14. Data Enter using R console.
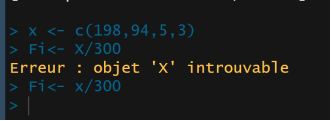
Figure 15. Entered Error in R software.
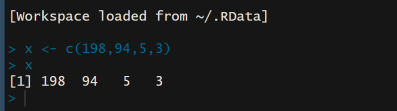
Figure 16. Correct Entered data in R Software.
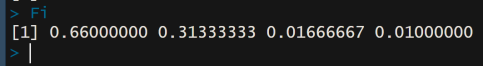
Figure 17. Relative frequency.

Figure 18. Relative Frequency in percentage.
Information