Abstract
Even though it affects many, malaria still causes major health issues in Ethiopia - especially in Argoba Woreda, where nature plays a big role in how the disease spreads. Instead of relying only on traditional methods, this work uses satellite images and digital mapping tools to spot places more likely to have outbreaks. Elevation matters a lot; lowland villages including Gobera and Chomiye see far more sickness compared to spots up high. Temperature patterns, land shape, closeness to rivers or lakes, rain levels, and greenness of plants help show which zones face greater danger. Rather than using one source alone, the analysis combines interviews with local workers, household feedback, official records, and space-based observations. Areas sitting higher places such as Amoye Serte and Kilkilo tend to stay safer because conditions there slow down infection cycles. While some communities struggle year after year, others remain relatively untouched thanks to their surroundings. High up places shaped where malaria spread most, making up 37 percent of the danger - temperature came next at 25 percent. More than seven out of ten parts of the woreda landed in risky or extremely risky categories, once the layers were weighed together. Where greenness dropped, malaria risk climbed sharply, showing how closely they move opposite each other across space. Mapping these patterns helps fit prevention work to actual ground conditions, using location data wisely. That final picture of risk isn’t just lines on a screen - it guides real choices in villages needing focused health efforts.
|
Published in
|
Advances in Applied Sciences (Volume 11, Issue 3)
|
|
DOI
|
10.11648/j.aas.20261103.14
|
|
Page(s)
|
82-97 |
|
Creative Commons
|

This is an Open Access article, distributed under the terms of the Creative Commons Attribution 4.0 International License (http://creativecommons.org/licenses/by/4.0/), which permits unrestricted use, distribution and reproduction in any medium or format, provided the original work is properly cited.
|
|
Copyright
|
Copyright © The Author(s), 2026. Published by Science Publishing Group
|
Keywords
Malaria, Geographic Information System, Remote Sensing, Environmental Factors, Risk Mapping
1. Background
Despite the development of new antimalarials and vector control interventions, malaria is still one of the most important global mosquito-borne infectious diseases, especially in sub-Saharan Africa
| [1] | Johnson, I. U., A. E. Asuquo, and S. C. Izah, Epidemiological trends and public health strategies in malaria control: A global perspective. ES General, 2024. 7: p. 1365. |
[1]
. Globally, there were around 249 million cases of malaria in 2022. The WHO African Region was the most affected, accounting for around 94% of all cases
| [2] | WHO, WHO malaria policy advisory group (MPAG) meeting report, 18-20 April 2023. 2023: World Health Organization. |
[2]
. Ethiopia is one of the malaria endemic countries severely affected by recurrent outbreaks due to conducive environmental and climatic conditions
| [3] | Woyessa, A., et al., El Niño and other climatic drivers of epidemic malaria in Ethiopia: new tools for national health adaptation plans. Malaria Journal, 2023. 22(1): p. 1-19. |
[3]
. The Ethiopian population lives in malaria risk areas mainly below 2000 meters above sea level, representing about 68% of the population
| [4] | Vajda, É. A. and C. E. Webb, Assessing the risk factors associated with malaria in the highlands of Ethiopia: what do we need to know? Tropical medicine and infectious disease, 2017. 2(1): p. 4. |
[4]
.
Transmission of malaria in Ethiopia varies spatially and temporally as a result of differences in altitude, rainfall, temperature, land cover and human activities
| [5] | Merga, B. B., et al., Environmental factors influencing mosquito breeding and malaria transmission using geospatial technologies in the Wabi Shebele sub-basin, Ethiopia. Scientific Reports, 2026. |
[5]
. The Amhara Region is among the most malaria burdened regions of the country
| [6] | Negatu, G. A., G. A. Abebe, and W. G. Yalew, Prevalence of Malaria and Associated Factors among Malaria‐Suspected Patients Attending Hamusit Health Center, Northwest Ethiopia: A Cross‐Sectional Study. Journal of Parasitology Research, 2022. 2022(1): p. 1306049. |
[6]
. This region is characterized by low altitude, high temperature and low rainfall. Malaria transmission is unstable and seasonal
| [7] | Lake, M. W., et al., Climate, environmental, and programmatic correlates of malaria resurgence in Amhara, Ethiopia (2018-2024): a Bayesian spatiotemporal analysis. Malaria Journal, 2026. |
[7]
. Argoba Woreda is found in this region. The entire woreda is malarious, with all population groups at risk of infection, according to the Argoba Woreda Health Department
| [8] | Aynalem, G., Chapter VIII-Protocol/Proposal for Epidemiologic Research Project. Ethiopian Field Epidemiology Training Program (EFETP), 2014. |
[8]
.
Environmental conditions that affect the breeding and survival of Anopheles mosquitoes have a great impact on the transmission of malaria
| [9] | Villena, O. C., et al., Temperature impacts the environmental suitability for malaria transmission by Anopheles gambiae and Anopheles stephensi. Ecology, 2022. 103(8): p. E3685. |
[9]
. The main variables that determine the risk of malaria are temperature, rainfall, elevation, vegetation cover and distance to water bodies
| [10] | Sallam, M. F., et al., Systematic review: Land cover, meteorological, and socioeconomic determinants of Aedes mosquito habitat for risk mapping. International journal of environmental research and public health, 2017. 14(10): p. 1230. |
[10]
. Recent studies have shown that climate variability and ecological changes are leading to an increase in malaria transmission in historically low-risk areas
| [11] | Mahmood, S., et al., climate change and the resurgence of malaria: a review of future environmental health risks. Spectrum of Engineering Sciences, 2026. 4(3): p. 455-469. |
[11]
.
GIS and RS technologies have advanced in ways that provide effective tools to analyze and map malaria risk areas
| [12] | Diriba, D., et al., Spatial analysis and mapping of malaria risk areas using geospatial technology in the case of Nekemte City, western Ethiopia. International journal of health geographics, 2024. 23(1): p. 27. |
[12]
. These geospatial techniques enable the integration of environmental and spatial data to identify high-risk areas, and to facilitate evidence-based strategies for malaria prevention and control
| [13] | Liu, K., et al., Geospatial epidemiological approaches to the prevention and control of vector-borne diseases: A systematic review. Infectious Diseases & Immunity, 2026. 6(1): p. 37-47. |
[13]
. However, despite the increasing importance of spatial analysis, few studies have been conducted in Argoba Woreda to delineate malaria risk areas using GIS and RS techniques.
This study, therefore, intends to map malaria risk areas in Argoba Woreda by analyzing environmental factors associated with malaria transmission using GIS and Remote Sensing techniques. The study also seeks to identify malaria-prone kebeles and develop a malaria risk map that can aid in targeted intervention and public health planning.
2. Materials and Methods
2.1. Description of the Study Area
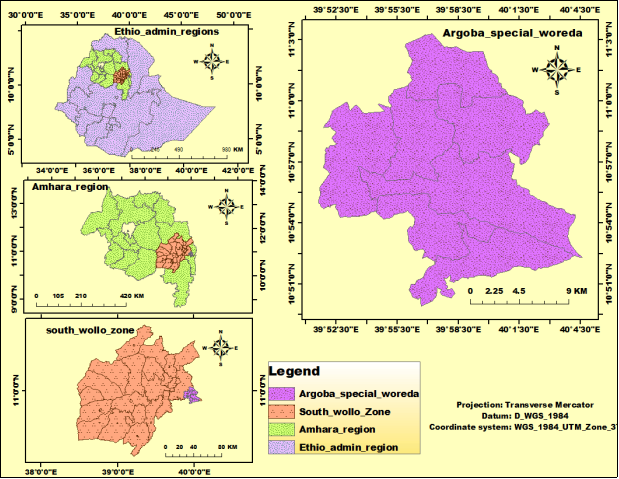
Argoba Special Woreda is one of the woredas in the Amhara Region of Ethiopia. The woreda is located around 566 km from the region’s capital, Bahir Dar and 399 km from the country’s capital, Addis Ababa. In terms of geography, the woreda is located between 10°01′00″ to 10°50′00″ N latitude and 39°51′30″ to 40°02′00″ E longitude. It is bordered by Oromia Special Zone in the north, Dewa Harewa Woreda in the south, Kalu Woreda in the west and Afar Regional State in the east
| [14] | Kifleyesus, A., Tradition and transformation: the Argobba of Ethiopia. Vol. 66. 2006: Otto Harrassowitz Verlag. |
[14]
.
Figure 1. Location map of the study.
2.2. Research Design and Approach
In order to evaluate malaria risk areas in Argoba Woreda, this study used a sequential mixed-methods research design that used quantitative and qualitative techniques. In order to produce thorough and trustworthy results, the mixed-methods approach allowed for the combination of geographical analysis, environmental assessment, field observation, and expert consultation. While qualitative methods assisted data validation and interpretation through field observation and discussions with local authorities and health professionals, quantitative techniques were primarily used in GIS and remote sensing studies.
2.3. Data Types and Sources
The study's goals were accomplished by using both primary and secondary data sources. Field observations, GPS point collecting, satellite imagery interpretation, and discussions with regional environmental specialists and health officials were all used to gather primary data. Both published and unpublished items, including books, journals, papers, articles, and websites, provided secondary data. The Argoba Woreda Health Office provided Annual Parasite Incidence (API) statistics and malaria case data.
Elevation data from the Shuttle Radar Topography Mission (SRTM), rainfall data from the Climate Hazards Group InfraRed Precipitation with Station data (CHIRPS), and temperature data from the CliWorld global climate dataset were among the environmental datasets used in the study. While NDVI values were obtained from MODIS satellite photography to assess vegetation conditions. Hydrographic layers and digital base maps were used in ArcGIS software to create proximity to water bodies.
2.4. Sampling Technique and Target Population
To choose representative kebeles within Argoba Woreda based on differences in malaria incidence and environmental circumstances, a purposive sampling technique was used. To represent the regional diversity in malaria transmission, both high-risk and low-risk kebeles were included. The selection criterion took into account elements including proximity to water bodies, vegetation cover, elevation variations, and Annual Parasite Incidence (API).
Residents in malaria-prone kebeles, health authorities engaged in malaria prevention and control initiatives, and environmental specialists with expertise in disease ecology and environmental health comprised the study's target group. Environmental specialists helped assess ecological aspects linked to malaria transmission, while health officers and epidemiologists provided crucial information on malaria trends and control strategies.
2.5. Data Processing and Analysis Techniques
The spatial distribution of malaria incidence within the research area was investigated using descriptive spatial analysis. The primary measure of the malaria burden at the kebele level was the Annual Parasite Incidence (API) per 1,000 people. Malaria distribution maps and disease concentration patterns were created using Inverse Distance Weighting (IDW) interpolation techniques.
The association between malaria incidence and environmental variables such elevation, temperature, rainfall, slope, and proximity to water bodies was examined using geostatistical analysis approaches, including zonal statistics. To ascertain the direction and intensity of correlations between environmental factors and malaria incidence, Pearson correlation analysis was performed.
A malaria risk map for the research area was created by integrating the main environmental factors that contribute to malaria transmission using a GIS-based weighted overlay analysis. Based on expert assessment and their relative impact to the incidence of malaria, environmental factors were given weights. The study region was divided into various malaria risk zones, ranging from very low to very high-risk categories, according to the final malaria risk map.
2.6. NDVI Analysis
Analysis of the Normalized Difference Vegetation Index (NDVI) was done to evaluate the link between malaria transmission and vegetation cover. The formula was used to calculate NDVI values from satellite images:
where Red stands for the electromagnetic spectrum's red band and NIR for the near-infrared band. In order to determine regions that are conducive to mosquito breeding and malaria transmission, the NDVI values were divided into several plant density classes and subjected to GIS analysis.
2.7. Software Packages and Tools
The study made use of a number of tools and software programs. Spatial analysis, GIS modeling, map production, and malaria risk mapping all benefited greatly from ArcGIS software. For statistical analysis, data organization, chart production, and correlation analysis, Microsoft Excel was utilized. During ground verification and accuracy assessment, field reference points were gathered using Garmin GPS 16 receivers with an accuracy of about three meters. Throughout the study process, EndNote X9 software was also used to handle citations and references.
2.8. Methodological Flow Chart of the Study
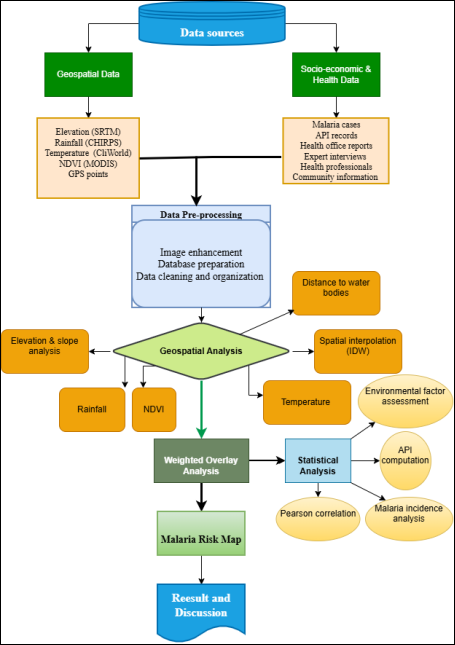
The study's overall methodological flowchart is depicted in the given picture (
Figure 2).
Figure 2. Methodological Flowchart of the study.
3. Results
3.1. Evaluation of Environmental Factors for Detecting Malaria Hazard Levels
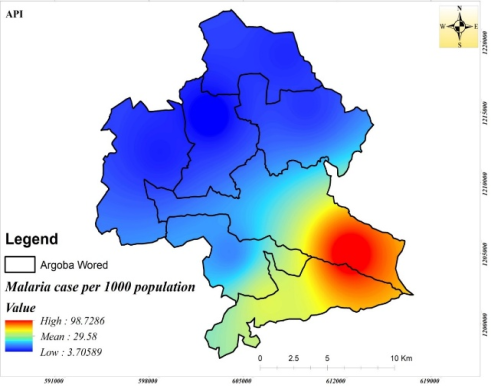
The results showed that lowland kebeles have a high concentration of malaria cases. With mean API values of 62 and 49 per 1,000 people, respectively, Gobera and Chomiye had the highest rates of malaria. In contrast, lower API values of about 10 per 1,000 people were found in Kilkilo and Amoye Serte, which are situated at comparatively higher elevations. These results show that altitude protects against the spread of malaria and provided a crucial foundation for the study's environmental variable selection and weighting.
Figure 3. Inverse Distance Weight (IDW) map of malaria case report per 1000 population.
3.2. Elevation
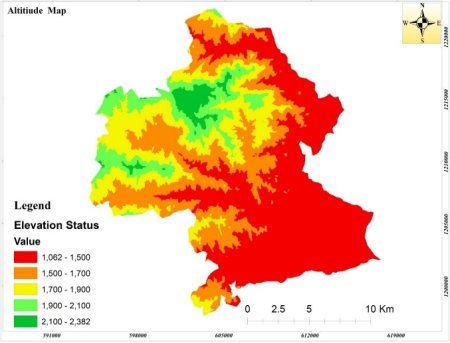
The most significant environmental factor influencing the distribution of malaria in Argoba Woreda was found to be elevation (as shown on
Figure 4). Elevation was divided into five malaria hazard groups based on peer review and spatial analysis: very high (1,062-1,500 m), high (1,500-1,700 m), moderate (1,700-1,900 m), low (1,900-2,100 m), and extremely low (>2,100 m).
Figure 4. Elevation profile of Argoba woreda.
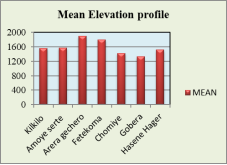
Figure 5. Mean Elevation graph of each kebele in Argoba Woreda.
Malaria was much more common in kebeles at lower elevations. The highest malaria cases were found in Gobera and Chomiye, which are located at average elevations of 1,325.46 m and 1,422.62 m, respectively. On the other hand, malaria incidence was comparatively lower in Arera Gechero and Fetekoma, which are situated at higher elevations of 1,898.89 m and 1,801.46 m, respectively. These results verify that lower-altitude regions offer ideal environmental conditions for parasite development and mosquito survival.
3.3. Temperature
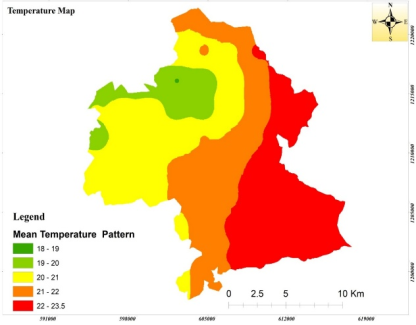
The second most significant environmental element linked to the spread of malaria was found to be temperature. According to the analysis, Argoba Woreda experiences temperatures between 18°C and 23.5°C (shown on
Figure 6).
Figure 6. Temperature pattern of Argoba woreda.
Patterns of malaria incidence closely matched the distribution of temperatures. Higher temperatures in lower-altitude kebeles were linked to an increase in the spread of malaria.
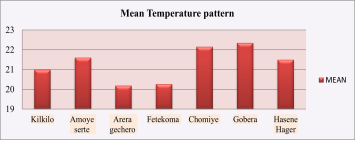
Figure 7. The mean Temperature pattern of Argoba woreda kebeles.
As shown on the above Figure (
Figure 7) With mean temperatures of 22.34°C and 22.14°C, respectively, Gobera and Chomiye had the highest rates of malaria. The mean temperatures at Arera Gechero and Fetekoma, on the other hand, were lower relatively.
3.4. Slope
Slope has been found to be the third environmental factor influencing the spread of malaria. Slope has a big impact on water buildup and the creation of mosquito-friendly breeding grounds
| [15] | Campbell, G., Malaria in precolonial malagasy history, in Disease dispersion and impact in the Indian ocean world. 2020, Springer. P. 129-167. |
[15]
.
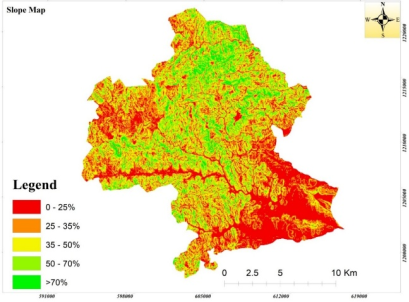
As shown on
Figure 8 Slope in the study region was divided into five groups based on appraisal and spatial analysis: 0-25%, 25-35%, 35-50%, 50-70%, and greater than 70% rise. The findings showed that whereas the highland kebeles of the woreda have steeper slopes that lessen the possibility of water pooling, the lowland kebeles are often characterized by softer slopes that promote water stagnation. The elevation profile and this pattern are quite similar.
Figure 8. Slope map of Argoba woreda in percent.
3.5. Proximity to Water Bodies
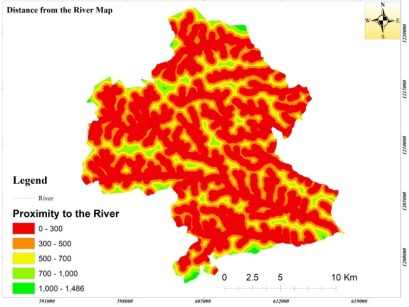
Figure 9. Proximity to water bodies map.
Another significant factor that has been found to influence the spread of malaria is proximity to rivers and streams. Mosquitoes can breed and survive in areas close to bodies of water
| [16] | Singh, H., N. Akhtar, and S. K. Gupta, Biology of mosquitoes, in Mosquitoes: Biology, Pathogenicity and Management. 2024, Springer. P. 141-163. |
[16]
. As shown on
Figure 9 according to spatial analysis, locations between 300 and 500 meters are classified as high-risk zones, while areas within 300 meters of rivers are considered very high-risk zones. Due to decreased mosquito dispersal, the risk of malaria rapidly declines beyond 500 meters.
3.6. Rainfall
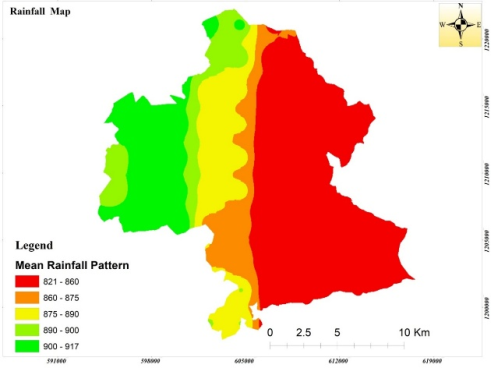
Rainfall was found to be the least significant environmental element influencing the spread of malaria on the study area. As shown on
Figure 10 the woreda receives between 821 and 917 mm of rain annually.
Figure 10. Rainfall Pattern Map of Argoba woreda.
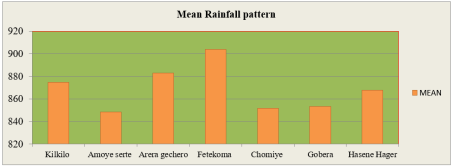
While lowland kebeles received less rainfall and had a greater prevalence of malaria, higher-elevation kebeles received comparatively more rainfall and had fewer malaria cases. For instance,
Figure 10 shows Rainfall Pattern of the area, Gobera and Chomiye had lesser rainfall and a higher malaria burden, while Fetekoma and Arera Gechero had higher rainfall values and a lower prevalence of malaria.
Figure 11. Mean-Rainfall graph of Argoba woreda kebeles.
3.7. Weighted Contribution of Environmental Factors
According to the findings as shown on
Table 1, elevation had the greatest impact, accounting for 37% of the determination of malaria risk. With 25%, temperature came in second, followed by rainfall (8%), slope (17%), and proximity to bodies of water (13%).
Table 1. Weighted values, ranks, and influence levels of environmental factors in determining malaria risk zones in Argoba Woreda.
Factors | Class | Rank | Hazard | Weight | Influence (%) |
Elevation (M) | 1062-1500 | 1 | Very High | | |
1500-1700 | 2 | High | | |
1700-1900 | 3 | Moderate | 0.37 | 37 |
1900-2100 | 4 | Low | | |
>2100 | 5 | Very Low | | |
Temperature (°C) | 18-19 | 5 | Very High | | |
19-20 | 4 | High | | |
20-21 | 3 | Moderate | 0.25 | 25 |
21-22 | 2 | Low | | |
22-23.5 | 1 | Very Low | | |
Slope (%) | 0-25 | 1 | Very High | | |
25-35 | 2 | High | | |
35-50 | 3 | Moderate | 0.17 | 17 |
50-70 | 4 | Low | | |
>70 | 5 | Very Low | | |
Proximity to river (m) | 0-300 | 1 | Very High | | |
300-500 | 2 | High | | |
500-700 | 3 | Moderate | 0.13 | 13 |
700-1000 | 4 | Low | | |
>1000 | 5 | Very Low | | |
Rainfall | 821-860 | 1 | Very High | | |
860-875 | 2 | High | | |
875-890 | 3 | Moderate | 0.8 | 8 |
890-900 | 4 | Low | | |
900-917 | 5 | Very Low | | |
Table 1 shows the weighted values, rankings, and influence levels of environmental elements in Argoba Woreda's malaria risk zones. The weighted analysis shows that temperature and elevation are the main factors influencing the risk of malaria in Argoba Woreda, with rainfall, slope, and proximity to rivers playing supporting roles.
3.8. Spatial Identification of Malaria Risk Zones
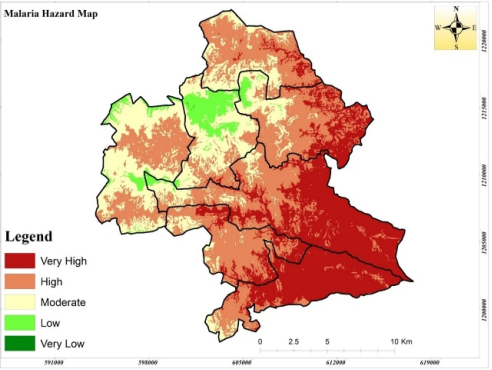
Argoba Woreda was divided into five malaria hazard categories very high, high, moderate, low, and very low risk based on the weighted overlay analysis (Shown on
Figure 12). The majority of the woreda falls into the high and extremely high-risk categories, according to the malaria danger map.
According to the analysis, 30.40% of the study area is classed as extremely high risk, while 41.46% of the region is rated as high risk. These two groups together make up over 70% of the woreda, demonstrating the extensive susceptibility to the spread of malaria. Low-risk and very low-risk zones make up only 4.86% and 0.01% of the woreda, respectively, whereas moderate-risk areas make up 23.28%.
Figure 12. Malaria risk map of Argoba Woreda.
Table 2. Descriptive Table of Malaria hazard classes at Woreda level.
Malaria Hazard Classes | Rank | Risk Level | Area (Hectare) | Percentage (%) |
Very High | 1 | Very High | 9367.11 | 30.40 |
High | 2 | High | 12778.47 | 41.46 |
Moderate | 3 | Moderate | 7172.91 | 23.28 |
Low | 4 | Low | 1499.31 | 4.86 |
Very Low | 5 | Very Low | 3.6 | 0.0117 |
As shown on
Table 2 the Argoba Woreda Health Office's 2023 malaria surveillance reports, which also showed that the malaria load is concentrated in lowland kebeles, are highly consistent with the spatial patterns found in this study.
3.9. Correlation Between Environmental Factors and Malaria Risk Levels
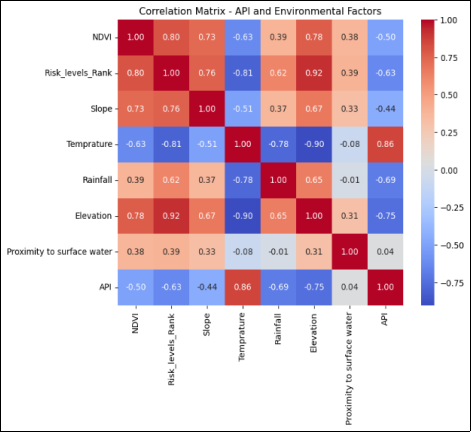
Strong correlations between environmental and remotely sensed factors and malaria risk were found in the investigation (shown on
Figure 13). There was a significant negative association (-0.63) between the malaria risk level and API, suggesting that high-risk zones are associated with greater rates of malaria. Elevation demonstrated the largest positive link with malaria risk levels (0.92), whereas NDVI demonstrated a substantial negative correlation (-0.80). Additionally, there was a large negative association (-0.81) between temperature and the incidence of malaria, moderate relationships with slope (0.76) and rainfall (0.62), and a relatively weaker correlation with proximity to rivers (0.39).
Figure 13. Correlation result.
The correlation result seen in
Figure 13 above These findings demonstrate that the weighted overlay analysis effectively captured the environmental elements impacting malaria transmission in the area.
3.10. Evaluation of Malaria Risk Variation Among Kebeles
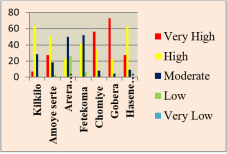
The findings showed that the risk of malaria varied significantly by kebele. With over 90% of their regions designated as high and very high malaria danger zones, Gobera and Chomiye were found to be the most vulnerable kebeles. Whereas Chomiye had 56.4% extremely high-risk and 34.6% high-risk zones, Gobera had 73% very high-risk and 22.7% high-risk areas.
Kilkilo and Fetekoma displayed comparatively mild malaria risk patterns, but Hasene Hager and Amoye Serte also showed widespread high-risk coverage. With over 75% of its territory categorized as moderate and low risk, Arera Gechero had the lowest malaria hazard values.
Figure 14. Malaria risk levels at kebele level.
Figure 14 above shows the risk of malaria at the kebele level. Overall, the results show that there is significant regional variation in the risk of malaria in the area.
Table 3. MAlaria hazard risk at kebele level.
Kebele | Malaria Hazard Classes | Rank | Risk Level | Area (Ha) | Percentage (%) |
Kilkilo | Very High | 1 | Very High | 244.3 | 7.1 |
High | 2 | High | 2202 | 63.9 |
Moderate | 3 | Moderate | 983.27 | 28.53 |
Low | 4 | Low | 16.4 | 0.48 |
Very Low | 5 | Very Low | _____ | ______ |
Amoye serte | Very High | 1 | Very High | 1209.365 | 27.51 |
High | 2 | High | 2236.157 | 50.87 |
Moderate | 3 | Moderate | 804.1824 | 18.3 |
Low | 4 | Low | 145.7569 | 3.32 |
Very Low | 5 | Very Low | _____ | ______ |
Arera gechero | Very High | 1 | Very High | 23.87 | 0.7 |
High | 2 | High | 762.1 | 22.45 |
Moderate | 3 | Moderate | 1703.44 | 50.19 |
Low | 4 | Low | 902.7 | 26.6 |
Very Low | 5 | Very Low | 2.0136 | 0.06 |
Fetekoma | Very High | 1 | Very High | _____ | ______ |
High | 2 | High | 1996.86 | 41.26 |
Moderate | 3 | Moderate | 2515.6 | 52 |
Low | 4 | Low | 325.61 | 6.73 |
Very Low | 5 | Very Low | 1 | 0.02 |
Chomiye | Very High | 1 | Very High | 4043.1 | 56.44 |
High | 2 | High | 2477 | 34.57 |
Moderate | 3 | Moderate | 566.1 | 7.9 |
Low | 4 | Low | 77.34 | 1.1 |
Very Low | 5 | Very Low | __0___ | __0____ |
Gobera | Very High | 1 | Very High | 2828.7 | 73 |
High | 2 | High | 880.6 | 22.72 |
Moderate | 3 | Moderate | 166 | 4.28 |
Low | 4 | Low | 0.06 | 0.0015 |
Very Low | 5 | Very Low | _____ | ______ |
Hasene Hager | Very High | 1 | Very High | 860 | 27.45 |
High | 2 | High | 1988.36 | 63.47 |
Moderate | 3 | Moderate | 284.51 | 9.1 |
Low | 4 | Low | _____ | ______ |
Very Low | 5 | Very Low | _____ | ______ |
The hazards of malaria in each kebele are shown in
Table 3. It contains a wealth of information, including the name of the kebele, the class of malaria hazard, its rank, the area in hectares, the proportion of the entire study area it covers, and the risk level, which can be low, moderate, or high. We may view the malaria hazard classes and risk level for each kebele by breaking down the malaria hazard risks by kebele.
3.11. Relationship Between NDVI and Malaria Risk
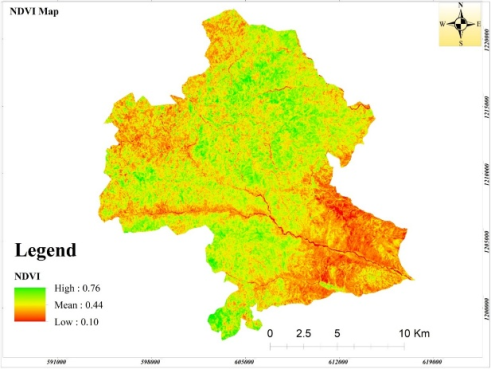
As shown on
Figure 15 the findings indicate that lower NDVI values were associated with Gobera and Chomiye, which had extremely high malaria hazard levels. Mosquito reproduction is facilitated by the bare surfaces, poor natural cover, and growing population in these places. On the other hand, Fetekoma and Arera Gechero had lower malaria risk levels and comparatively greater NDVI values.
Figure 15. NDVI map of Argoba woreda.
The significance of land cover conditions in regulating mosquito ecology and malaria transmission dynamics is confirmed by the negative correlations between NDVI and malaria risk.
4. Discussion
The results showed that environmental factors, including elevation, temperature, slope, proximity to water bodies, and rainfall, all have a significant impact on the risk of malaria. A significant majority of the population lives in environments that are conducive to the spread of malaria, as evidenced by the fact that more than 70% of the woreda was categorized as having a high or very high malaria hazard.
Elevation was shown to be the most significant factor, accounting for 37% of the malaria hazard model. According to earlier research, lower-altitude regions offer ideal conditions for mosquito survival, breeding, and parasite development because of warmer temperatures and appropriate humidity levels
| [17] | Zablon, J., et al., Mapping mosquito diversity in Kenya correlating species distribution with malaria prevalence across varied malaria climatic parameters. 2026. |
[17]
. This is consistent with the inverse relationship between elevation and malaria incidence. The concentration of high malaria prevalence in lower-elevation areas like Gobera and Chomiye provides more evidence that topography influences the dynamics of malaria transmission. Similar results have been documented in Ethiopia and other malaria-endemic areas where elevation has a major role in determining the distribution of vectors and the incidence of the disease
| [18] | Assefa, G. M., M. D. Muluneh, and Z. A. Alemu, The relationship of climate change and malaria incidence in the Gambella Region, Ethiopia. Climate, 2025. 13(5): p. 104. |
[18]
.
It was shown that temperature was the second most significant factor affecting the risk of malaria. Higher temperatures were associated with higher malaria incidence, but decreased risk was seen in colder highland locations
| [19] | Endo, N. And E. A. Eltahir, Increased risk of malaria transmission with warming temperature in the Ethiopian Highlands. Environmental Research Letters, 2020. 15(5): p. 054006. |
[19]
. This result is consistent with research showing that warmth enhances mosquito growth, biting frequency, and parasite incubation durations, all of which increase the potential for transmission
| [20] | Dahlin, K. J. M., et al., Impacts of host availability and temperature on mosquito‐borne parasite transmission. Ecological monographs, 2024. 94(2): p. E1603. |
[20]
. The significance of thermal circumstances in determining malaria adaptability is confirmed by the study's strong negative association between temperature and malaria risk ranking.
Malaria risk was also significantly impacted by slope. Because they encourage water stagnation and the creation of breeding habitats, areas with mild slopes were linked to greater hazard levels. On the other hand, steep slopes decrease the amount of standing water that mosquitoes may grow in and promote runoff
| [21] | Zawarus, P., Green infrastructure for mosquito control, in Architectural Factors for Infection and Disease Control. 2022, Routledge. P. 109-125. |
[21]
. Similar findings, emphasizing the significance of topographical features in regulating the geographical distribution of mosquito habitats
| [22] | Dida, G. O., et al., Spatial distribution and habitat characterization of mosquito species during the dry season along the Mara River and its tributaries, in Kenya and Tanzania. Infectious diseases of poverty, 2018. 7(1): p. 2. |
[22]
.
The risk of malaria was also significantly influenced by proximity to waterways. Because mosquito populations are supported by breeding habitats and water sources, areas near rivers and streams showed higher risk
| [23] | Hanford, J. K., C. E. Webb, and D. F. Hochuli, Habitat traits associated with mosquito risk and aquatic diversity in urban wetlands. Wetlands, 2019. 39(4): p. 743-758. |
[23]
. However, the very modest association found in this study indicates that, without taking into account interaction factors like elevation, temperature, and river proximity alone is insufficient to explain malaria risk. Similar results, highlighting the joint impact of climatic and hydrological factors on malaria transmission
| [24] | Yaladanda, N., et al., The synergistic effect of climatic factors on malaria transmission: a predictive approach for northeastern states of India. Environmental Science and Pollution Research, 2023. 30(21): p. 59194-59211. |
[24]
.
With only 8% of the total influence, rainfall made the least contribution to the malaria hazard model. Rainfall is necessary to create mosquito breeding grounds, but too much rain might have flushing effects that lower larval survival
| [25] | Day, J. F., Mosquito oviposition behavior and vector control. Insects, 2016. 7(4): p. 65. |
[25]
. The study's finding of an inverse link between rainfall and malaria incidence implies that lowland locations with moderate rainfall may offer better breeding conditions than those with higher rainfall. Studies carried out in other tropical regions, where the association between rainfall and malaria transmission is frequently nonlinear and context-dependent, have reported similar findings
| [26] | Amadi, M. And K. H. Erandi, Assessing the relationship between malaria incidence levels and meteorological factors using cluster-integrated regression. BMC Infectious Diseases, 2024. 24(1): p. 664. |
[26]
.
The malaria hazard model was further confirmed by the Pearson correlation study. The spatial risk map closely matches observed malaria incidence, as evidenced by the high negative correlation (-0.63) between API and malaria risk rating. The significance of land cover conditions in determining malaria vulnerability is also demonstrated by the strong inverse association (-0.80) between NDVI and malaria risk. Higher malaria risk was linked to areas with lower NDVI values, which indicate bare ground, populated areas, and water surfaces
| [27] | Mcmahon, A., et al., Remote sensing of environmental risk factors for malaria in different geographic contexts. International Journal of Health Geographics, 2021. 20(1): p. 28. |
[27]
. Since plant and land-cover conditions directly affect mosquito habitat availability and human-vector interactions, this conclusion is consistent with earlier research that found NDVI to be an excellent indication of malaria suitability [
28].
With over 90% of their areas categorized as high or very high danger, Gobera and Chomiye were found to be the main hotspots for malaria. On the other hand, because of their higher elevations, lower temperatures, and less conducive climatic conditions for vector breeding, Arera Gechero and Fetekoma showed relatively lower risk levels. The trustworthiness of the GIS-based method employed in this work is demonstrated by the near alignment of these spatial patterns with malaria surveillance records by the Argoba Woreda Health Office.
Overall, the results show that topographic and climatic conditions, especially elevation and temperature, are the main drivers of malaria risk in Argoba Woreda. Malaria-prone areas were identified and local differences in vulnerability were highlighted by the integration of environmental variables using GIS and multi-criteria decision analysis. In order to prioritize surveillance, vector control activities, and resource allocation toward high-risk kebeles like Gobera, Chomiye, and Hasene Hager, the resulting malaria hazard map offers important evidence. These geographically focused strategies are crucial for enhancing malaria prevention and assisting the woreda's evidence-based public health planning.
5. Conclusion
This study successfully identified and mapped malaria hazard zones in Argoba Woreda using Geographic Information System (GIS) and Multi-Criteria Decision Analysis (MCDA) methodologies, taking into account important environmental characteristics such as elevation, temperature, slope, proximity to water bodies, and rainfall. A thorough grasp of the spatial distribution of malaria risk throughout the woreda was made possible by the integration of these variables using a weighted overlay analysis. The results showed that environmental factors, especially elevation and temperature, had a significant impact on the spread of malaria in Argoba Woreda. With a 37% contribution to the model, elevation was found to be the most significant factor influencing the risk of malaria, followed by temperature (25%), slope (17%), proximity to water bodies (13%), and rainfall (8%). It was discovered that lower-altitude regions with milder temperatures, mild slopes, and close proximity to rivers were ideal for the spread of malaria. On the other hand, the risk of malaria was reduced in higher-altitude regions with steeper terrain and colder temperatures.
A significant portion of the woreda is susceptible to malaria transmission, according to the malaria danger map. Over 70% of the woreda is in an environment that is conducive to the occurrence of malaria, with about 41.46% of the region classed as high risk and 30.40% as extremely high risk. Gobera and chomiye were the most vulnerable kebeles, with more than 90% of the land classified as having a high or extremely high risk of malaria. On the other hand, because of their higher elevations and less conducive environmental circumstances for mosquito development, arera gechero and fetekoma showed comparatively reduced risk.
The reliability of the malaria hazard model was further validated by the correlation analysis. Environmental factors, especially elevation, temperature, and NDVI, were found to have strong correlations with malaria risk. Higher malaria risk was linked to areas with less plant cover and lower NDVI values, underscoring the significance of land-cover features in the dynamics of malaria transmission.
All things considered, the study shows that GIS-based environmental suitability modeling is a useful method for locating malaria-prone regions and comprehending regional differences in malaria sensitivity. For Argoba Woreda's malaria prevention and control initiatives, the created malaria danger map offers important spatial evidence. In high-risk kebeles, the findings can help health authorities and decision-makers prioritize monitoring, vector control measures, resource distribution, and community awareness campaigns. Improving malaria control efforts and lowering the disease burden within the woreda can be achieved by implementing targeted interventions in designated hotspot locations, including Gobera, Chomiye, and Hasene Hager.
Abbreviations
API | Annual Parasite Incidence |
CHIRPS | Climate Hazards Group InfraRed Precipitation with Station Data |
GIS | Geographic Information System |
NDVI | Normalized Difference Vegetation Index |
RS | Remote Sensing |
SRTM | Shuttle Radar Topography Mission |
MCDA | Multi-Criteria Decision Analysis |
WHO | World Health Organization |
Acknowledgments
The author would like to thank the Argoba Woreda Health Office for supplying the Annual Parasite Incidence (API) statistics and malaria case records utilized in this study. I also thank the Shuttle Radar Topography Mission (SRTM) for elevation data, the Climate Hazards Group InfraRed Precipitation with Station Data (CHIRPS) for rainfall datasets, the CliWorld climate database for temperature data, and the MODIS satellite data repository for vegetation (NDVI) datasets. Lastly, I would like to express our gratitude to the creators and suppliers of the geographic information and mapping tools utilized in this research, which enabled the mapping of malaria risk and geographical analysis.
Author Contributions
Efrem Wubie Addis: Conceptualization, Data curation, Formal Analysis, Investigation, Methodology, Resources, Software, Validation, Visualization, Writing – original draft, Writing – review & editing
Yibeltal Ayenew Yigrem: Data curation, Supervision, Validation, Investigation, Visualization, Methodology, Writing – review & editing
Data Availability Statement
Without unnecessary reluctance, the author will make the raw data supporting this article's results available.
Conflicts of Interest
The research was carried out without any financial or commercial ties that might be seen as a potential conflict of interest, according to the author.
References
| [1] |
Johnson, I. U., A. E. Asuquo, and S. C. Izah, Epidemiological trends and public health strategies in malaria control: A global perspective. ES General, 2024. 7: p. 1365.
|
| [2] |
WHO, WHO malaria policy advisory group (MPAG) meeting report, 18-20 April 2023. 2023: World Health Organization.
|
| [3] |
Woyessa, A., et al., El Niño and other climatic drivers of epidemic malaria in Ethiopia: new tools for national health adaptation plans. Malaria Journal, 2023. 22(1): p. 1-19.
|
| [4] |
Vajda, É. A. and C. E. Webb, Assessing the risk factors associated with malaria in the highlands of Ethiopia: what do we need to know? Tropical medicine and infectious disease, 2017. 2(1): p. 4.
|
| [5] |
Merga, B. B., et al., Environmental factors influencing mosquito breeding and malaria transmission using geospatial technologies in the Wabi Shebele sub-basin, Ethiopia. Scientific Reports, 2026.
|
| [6] |
Negatu, G. A., G. A. Abebe, and W. G. Yalew, Prevalence of Malaria and Associated Factors among Malaria‐Suspected Patients Attending Hamusit Health Center, Northwest Ethiopia: A Cross‐Sectional Study. Journal of Parasitology Research, 2022. 2022(1): p. 1306049.
|
| [7] |
Lake, M. W., et al., Climate, environmental, and programmatic correlates of malaria resurgence in Amhara, Ethiopia (2018-2024): a Bayesian spatiotemporal analysis. Malaria Journal, 2026.
|
| [8] |
Aynalem, G., Chapter VIII-Protocol/Proposal for Epidemiologic Research Project. Ethiopian Field Epidemiology Training Program (EFETP), 2014.
|
| [9] |
Villena, O. C., et al., Temperature impacts the environmental suitability for malaria transmission by Anopheles gambiae and Anopheles stephensi. Ecology, 2022. 103(8): p. E3685.
|
| [10] |
Sallam, M. F., et al., Systematic review: Land cover, meteorological, and socioeconomic determinants of Aedes mosquito habitat for risk mapping. International journal of environmental research and public health, 2017. 14(10): p. 1230.
|
| [11] |
Mahmood, S., et al., climate change and the resurgence of malaria: a review of future environmental health risks. Spectrum of Engineering Sciences, 2026. 4(3): p. 455-469.
|
| [12] |
Diriba, D., et al., Spatial analysis and mapping of malaria risk areas using geospatial technology in the case of Nekemte City, western Ethiopia. International journal of health geographics, 2024. 23(1): p. 27.
|
| [13] |
Liu, K., et al., Geospatial epidemiological approaches to the prevention and control of vector-borne diseases: A systematic review. Infectious Diseases & Immunity, 2026. 6(1): p. 37-47.
|
| [14] |
Kifleyesus, A., Tradition and transformation: the Argobba of Ethiopia. Vol. 66. 2006: Otto Harrassowitz Verlag.
|
| [15] |
Campbell, G., Malaria in precolonial malagasy history, in Disease dispersion and impact in the Indian ocean world. 2020, Springer. P. 129-167.
|
| [16] |
Singh, H., N. Akhtar, and S. K. Gupta, Biology of mosquitoes, in Mosquitoes: Biology, Pathogenicity and Management. 2024, Springer. P. 141-163.
|
| [17] |
Zablon, J., et al., Mapping mosquito diversity in Kenya correlating species distribution with malaria prevalence across varied malaria climatic parameters. 2026.
|
| [18] |
Assefa, G. M., M. D. Muluneh, and Z. A. Alemu, The relationship of climate change and malaria incidence in the Gambella Region, Ethiopia. Climate, 2025. 13(5): p. 104.
|
| [19] |
Endo, N. And E. A. Eltahir, Increased risk of malaria transmission with warming temperature in the Ethiopian Highlands. Environmental Research Letters, 2020. 15(5): p. 054006.
|
| [20] |
Dahlin, K. J. M., et al., Impacts of host availability and temperature on mosquito‐borne parasite transmission. Ecological monographs, 2024. 94(2): p. E1603.
|
| [21] |
Zawarus, P., Green infrastructure for mosquito control, in Architectural Factors for Infection and Disease Control. 2022, Routledge. P. 109-125.
|
| [22] |
Dida, G. O., et al., Spatial distribution and habitat characterization of mosquito species during the dry season along the Mara River and its tributaries, in Kenya and Tanzania. Infectious diseases of poverty, 2018. 7(1): p. 2.
|
| [23] |
Hanford, J. K., C. E. Webb, and D. F. Hochuli, Habitat traits associated with mosquito risk and aquatic diversity in urban wetlands. Wetlands, 2019. 39(4): p. 743-758.
|
| [24] |
Yaladanda, N., et al., The synergistic effect of climatic factors on malaria transmission: a predictive approach for northeastern states of India. Environmental Science and Pollution Research, 2023. 30(21): p. 59194-59211.
|
| [25] |
Day, J. F., Mosquito oviposition behavior and vector control. Insects, 2016. 7(4): p. 65.
|
| [26] |
Amadi, M. And K. H. Erandi, Assessing the relationship between malaria incidence levels and meteorological factors using cluster-integrated regression. BMC Infectious Diseases, 2024. 24(1): p. 664.
|
| [27] |
Mcmahon, A., et al., Remote sensing of environmental risk factors for malaria in different geographic contexts. International Journal of Health Geographics, 2021. 20(1): p. 28.
|
| [28] |
Marti, R., et al., Relationships between vector mosquitoes and the environment: the role of satellite remote sensing methods. Remote sensing and spatialmodelling, 2025: p. 19.
|
Cite This Article
-
APA Style
Addis, E. W., Yigrem, Y. A. (2026). Geospatial Malaria Risk Mapping: Assessing Environmental Determinants in Argoba Woreda, Ethiopia. Advances in Applied Sciences, 11(3), 82-97. https://doi.org/10.11648/j.aas.20261103.14
 Copy
|
Copy
|
 Download
ACS Style
Addis, E. W.; Yigrem, Y. A. Geospatial Malaria Risk Mapping: Assessing Environmental Determinants in Argoba Woreda, Ethiopia. Adv. Appl. Sci. 2026, 11(3), 82-97. doi: 10.11648/j.aas.20261103.14
Copy
|
Download
AMA Style
Addis EW, Yigrem YA. Geospatial Malaria Risk Mapping: Assessing Environmental Determinants in Argoba Woreda, Ethiopia. Adv Appl Sci. 2026;11(3):82-97. doi: 10.11648/j.aas.20261103.14
Copy
|
Download
-
@article{10.11648/j.aas.20261103.14,
  author = {Efrem Wubie Addis and Yibeltal Ayenew Yigrem},
  title = {Geospatial Malaria Risk Mapping: Assessing Environmental Determinants in Argoba Woreda, Ethiopia},
  journal = {Advances in Applied Sciences},
  volume = {11},
  number = {3},
  pages = {82-97},
  doi = {10.11648/j.aas.20261103.14},
  url = {https://doi.org/10.11648/j.aas.20261103.14},
  eprint = {https://article.sciencepublishinggroup.com/pdf/10.11648.j.aas.20261103.14},
  abstract = {Even though it affects many, malaria still causes major health issues in Ethiopia - especially in Argoba Woreda, where nature plays a big role in how the disease spreads. Instead of relying only on traditional methods, this work uses satellite images and digital mapping tools to spot places more likely to have outbreaks. Elevation matters a lot; lowland villages including Gobera and Chomiye see far more sickness compared to spots up high. Temperature patterns, land shape, closeness to rivers or lakes, rain levels, and greenness of plants help show which zones face greater danger. Rather than using one source alone, the analysis combines interviews with local workers, household feedback, official records, and space-based observations. Areas sitting higher places such as Amoye Serte and Kilkilo tend to stay safer because conditions there slow down infection cycles. While some communities struggle year after year, others remain relatively untouched thanks to their surroundings. High up places shaped where malaria spread most, making up 37 percent of the danger - temperature came next at 25 percent. More than seven out of ten parts of the woreda landed in risky or extremely risky categories, once the layers were weighed together. Where greenness dropped, malaria risk climbed sharply, showing how closely they move opposite each other across space. Mapping these patterns helps fit prevention work to actual ground conditions, using location data wisely. That final picture of risk isn’t just lines on a screen - it guides real choices in villages needing focused health efforts.},
 year = {2026}
}
Copy
|
Download
-
TY  - JOUR
T1  - Geospatial Malaria Risk Mapping: Assessing Environmental Determinants in Argoba Woreda, Ethiopia
AU  - Efrem Wubie Addis
AU  - Yibeltal Ayenew Yigrem
Y1  - 2026/07/24
PY  - 2026
N1  - https://doi.org/10.11648/j.aas.20261103.14
DO  - 10.11648/j.aas.20261103.14
T2  - Advances in Applied Sciences
JF  - Advances in Applied Sciences
JO  - Advances in Applied Sciences
SP  - 82
EP  - 97
PB  - Science Publishing Group
SN  - 2575-1514
UR  - https://doi.org/10.11648/j.aas.20261103.14
AB  - Even though it affects many, malaria still causes major health issues in Ethiopia - especially in Argoba Woreda, where nature plays a big role in how the disease spreads. Instead of relying only on traditional methods, this work uses satellite images and digital mapping tools to spot places more likely to have outbreaks. Elevation matters a lot; lowland villages including Gobera and Chomiye see far more sickness compared to spots up high. Temperature patterns, land shape, closeness to rivers or lakes, rain levels, and greenness of plants help show which zones face greater danger. Rather than using one source alone, the analysis combines interviews with local workers, household feedback, official records, and space-based observations. Areas sitting higher places such as Amoye Serte and Kilkilo tend to stay safer because conditions there slow down infection cycles. While some communities struggle year after year, others remain relatively untouched thanks to their surroundings. High up places shaped where malaria spread most, making up 37 percent of the danger - temperature came next at 25 percent. More than seven out of ten parts of the woreda landed in risky or extremely risky categories, once the layers were weighed together. Where greenness dropped, malaria risk climbed sharply, showing how closely they move opposite each other across space. Mapping these patterns helps fit prevention work to actual ground conditions, using location data wisely. That final picture of risk isn’t just lines on a screen - it guides real choices in villages needing focused health efforts.
VL  - 11
IS  - 3
ER  -
Copy
|
Download





 Share This Article
 Twitter
 Linked In
 Facebook